The result
Same pods, same 2-CPU limit, same Node 26.13. A prod day of content traffic now needs 65% less CPU (2.9 → 1.0 core-hours). One pod serves 223 → 462 req/s on the prod route mix, and 675 req/s with two worker threads. Prod peaked at 76 req/s this week. Memory per pod on one thread: 368 → 354 MiB RSS. Every change was checked response-for-response against the old code: 0 differences.
The gains at a glance

1 · Ship PR #4593
- Every route ×1.4–3.4 req/s, same pods, identical responses.
- Biggest lever by far: the watch-list fan-out (18 content calls per page → 1) and per-request overhead.
- Low risk: no new infra; one new endpoint, a few new cache fields.
2 · Then the next levers
- 2 worker threads per pod: +15–63% req/s, +~270 MiB per pod.
- Trim telemetry (10% sampling, keep it on): −7% to −16% CPU, config only.
- Bun: −4% to −27% CPU on top, +100–300 MiB; needs a soak first.
3 · Keep it fixed
- 15 count-based guard specs now run on every PR (in #4593).
- Planned: per-PR TestStack gates that catch new slow code generically (HOI-4155, HOI-4157).
Every stage, every route
- Today
- The code running before HOI-4097.
- Node
- This PR (#4593), one thread, Node 26.
- Node ×2 threads
- Same code, two worker threads per pod. Not in the PR; an option.
- Bun
- Same code plus the stacked Bun fixes, on Bun 1.4.4. Telemetry on.
- Bun ×2 threads
- Bun with two worker threads per pod (SO_REUSEPORT). Not in either PR; an option.
One chart per route, same layout as the chart above. Pills under each bar = change vs today (green = better, orange = costs more). Same pod type and 2 CPU / 2 GiB limit as prod, 3 interleaved rounds, medians.
Watch-list pagecoreNodeCPU −43%×1.8 req/sNode ×2CPU −43%×2.7 req/sBunCPU −55%×2.1 req/sBun ×2CPU −50%×3.3 req/s

Single titlecore + appsNodeCPU −31%×1.4 req/sNode ×2CPU −29%×2.2 req/sBunCPU −41%×1.6 req/sBun ×2CPU −34%×2.4 req/s

Watch-history displayanalyticsNodeCPU −44%×1.7 req/sNode ×2CPU −41%×2.8 req/sBunCPU −46%×1.7 req/sBun ×2CPU −47%×2.9 req/s

Watch-history gatesanalyticsNodeCPU −36%×1.6 req/sNode ×2CPU −32%×2.3 req/sBunCPU −47%×1.8 req/sBun ×2CPU −36%×2.6 req/s

contentDatacoreNodeCPU −60%×2.5 req/sNode ×2CPU −59%×4.0 req/sBunCPU −70%×3.0 req/sBun ×2CPU −66%×3.0 req/s

Entitlement (play)appsNodeCPU −67%×3.2 req/sNode ×2CPU −65%×4.5 req/sBunCPU −69%×3.4 req/sBun ×2CPU −68%×5.4 req/s

Page routesapps via CDNNodeCPU −70%×3.4 req/sNode ×2CPU −69%×3.9 req/sBunCPU −78%×4.4 req/sBun ×2CPU −77%×5.1 req/s

How the numbers were made comparable
CPU per request = pod CPU ÷ successful requests. RSS = process memory under load. req/s = one pod at the test's concurrency. The 2-thread column applies its measured gain over 1 thread (both at 32 connections) to the 1-thread figure. The Bun column applies Bun's ratio over Node, measured on one lane in the same run, to the Node column; Bun's memory is as measured. A dash means no clean measurement.
Route by route
Start build (the code before HOI-4097, stock device detector) vs final build (7ec063a738, all 20 changes, patched detector), same lab pod and data, 3 interleaved rounds, medians, clean process environment recorded on every run. In-cluster routes uncompressed; play and pages compressed like their clients.
| Route | Caller | Prod calls/day | CPU/request before | after | CPU | req/s per pod | p99 ms | RSS MiB |
|---|---|---|---|---|---|---|---|---|
| Watch-list page | core | 370,317 | 36.5 ms × items | 1.80 ms | −95% | 384 → 679 (+77%) | 98 → 57 | 367 → 346 |
| Single title | core + apps | 980,634 | 3.10 ms | 2.15 ms | −31% | 390 → 554 (+42%) | 90 → 67 | 364 → 359 |
| Watch-history display | analytics | 283,050 | 4.12 ms | 2.32 ms | −44% | 303 → 520 (+72%) | 110 → 70 | 373 → 344 |
| Watch-history gates | analytics | 285,405 | 2.04 ms | 1.30 ms | −36% | 561 → 885 (+58%) | 58 → 39 | 356 → 345 |
| contentData | core | 155,326 | 2.39 ms | 0.95 ms | −60% | 474 → 1172 (+147%) | 65 → 26 | 368 → 354 |
| Entitlement (play) | apps | 225,411 | 15.40 ms | 5.02 ms | −67% | 71 → 228 (+220%) | 469 → 169 | 374 → 388 |
| Page routes | apps via CDN | 9,430 | 205.43 ms | 62.13 ms | −70% | 8 → 25 (+239%) | 1554 → 484 | 516 → 456 |
Where the wins came from
- Watch-list: one call per page instead of one per item (18 → 1 in a prod trace), card-sized cache entries.
- Pages: trays read a trimmed copy of each title, each title once per page, and replies stay on V8's fast JSON path.
- Analytics routes and contentData: read only the fields the caller uses.
- Play (entitlement): one shared device detector, regex patch (7.2 → 1.9 ms per detection).
- Everywhere: no compression between our own services, dead log lines gone, one Mongo handle per client.
Left on the table (needs a decision)
- 2 worker threads per pod: one event loop can't use the second CPU.
- Telemetry: measured cost per request below; sampling or lighter instrumentation would cut it.
- Compression in the pod for gzip/br clients: up to 37% of a request; could move to the edge.
- Framework: Nest + Express + middleware is 34–80% of a small request (rewrite measured below).
Why core calls content so much
Before: one call per watch-list item
One watch-list open in prod: core made 18 parallel GET /contents?contentId=…; each took 95–136 ms because they queued inside content, so the page took 275 ms. 370k watch-list pages a day caused ~897k of content's 980k title calls. Prod trace
After: one batch call per page
POST /contents/watch-list-display takes the page's ids and returns card-sized items. The other core path, a title page (160k/day), makes one cheap contentData call to learn movie vs series and season/episode ids for watch history and rating. Prod trace
More from the same pod: threads
One Node event loop tops out at ~1.2 of the pod's 2 CPUs (event-loop utilisation 0.98–1.00 at saturation). Two worker threads in the same process, both listening on the same port (SO_REUSEPORT), use the second CPU. Final build, 32 connections (8 for pages), 3 rounds.
| Route | req/s 1 thread | req/s 2 threads | CPU cores used | RSS MiB |
|---|---|---|---|---|
| Watch-list page | 710 | 1094 (+54%) | 1.25 → 2.00 | 366 → 631 |
| Single title | 573 | 906 (+58%) | 1.22 → 2.00 | 375 → 653 |
| Watch-history display | 515 | 825 (+60%) | 1.28 → 2.00 | 379 → 645 |
| Watch-history gates | 915 | 1309 (+43%) | 1.17 → 1.81 | 366 → 614 |
| contentData | 1234 | 2012 (+63%) | 1.12 → 1.99 | 345 → 624 |
| Entitlement (play) | 229 | 319 (+39%) | 1.16 → 1.73 | 404 → 675 |
| Page routes | 26 | 30 (+15%) | 1.68 → 1.95 | 477 → 799 |
Platformatic Watt (what X runs) — measured separately
Watt 3.77 with 2 workers, same pod, earlier build: +9% to +49% req/s, about 5–20% more CPU per request than a bare launcher, and RSS 810–1,008 MiB (bare launcher 584–769). In 1 of 3 rounds per route only one of its two workers took connections; with tight ELU health limits it replaced workers that were simply busy. Stuck-worker test (one request blocks a worker 90 s): 1 thread served 25.5% of probes, bare 2 threads 66.2%, Watt 47.8% — it replaced the stuck worker after ~30 s, but a worker spinning in JS keeps receiving connections. Details: runtime page.
What Node cannot go below
Where each request's CPU goes on the final build, on the main thread, with profiler overhead removed (unprofiled schedstat × profiled shares). From the node-floor lane: n26-floor-table.txt.
| Route | CPU per request (main thread) | Where it goes (ms) |
|---|---|---|
| Single title | 1.61 ms | JSON 0.37 (cache parse 0.24 + reply 0.14) · node http/syscalls 0.28 · Nest/Express 0.23 · zstd decode 0.19 · OTel 0.10 · BSON 0.09 · GC 0.08 · ETag 0.06 |
| Watch-list | 1.13 ms | Nest/Express 0.23 · node 0.20 · app 0.18 · zstd 0.14 · JSON 0.12 · OTel 0.08 · GC 0.05 |
| Watch-history display | 1.62 ms | BSON + driver 0.48 · node 0.37 · Nest/Express 0.21 · OTel 0.13 · JSON 0.10 · GC 0.08 |
| Watch-history gates | 0.93 ms | node 0.21 · BSON 0.20 · Nest/Express 0.19 · OTel 0.10 |
| contentData | 0.65 ms | BSON 0.15 · node 0.15 · Nest/Express 0.12 · OTel 0.08 |
| Entitlement | 3.78 ms | device detection 1.22 · node 0.75 · Nest/Express 0.48 · BSON 0.29 · OTel 0.25 |
| Pages (a 1–6 MB page) | 34 ms | JSON 8.6 (cache parse 5.3 + reply 3.3) · zstd 6.8 · node 4.3 · GC 3.8 |
How to read this
These are CPU milliseconds per request, not response time. Response time also includes waiting on Mongo/Valkey and queueing (single title p99 ≈ 67 ms under load). CPU per request decides how many requests a pod can serve: at 1.6 ms of main-thread CPU, one event loop tops out around 600 single-title requests per second.
The hard floor (bare Node on the same pod)
- node:http request/response: ~0.03–0.04 ms; Express adds ~0.04 ms; NodeAdapter halves dispatch.
JSON.parse~2.9 ms/MB ·JSON.stringify~2.6–2.8 ms/MB · ETag sha1 ~0.2 ms/MB.- zstd decode via Node's binding costs ~2× Bun's on small entries (chunked binding).
- One event loop: ELU 0.98–1.00 at 1.07–1.35 cores; the second CPU is unusable without threads.
V8 JSON fast path (found here, fixed in #20)
- All-or-nothing: one ineligible object anywhere sends the whole
JSON.stringifyto the slow path (~3.5× slower). - Ineligible: class instances, dictionary-mode objects, getters/toJSON, Date, numeric-like keys, cons/sliced strings.
- Dictionary mode comes from
delete,JSON.parseof >128-key objects, andObject.assign({}, x)at ≥20 keys — which is what tsc emits for{...x}at our es2017 target. - Fix: copy the 10 class shells with
Object.fromEntries;= undefinedinstead ofdelete. Pages −9.1%, display −9.3%.
What Node cannot scale past, per pod: one event loop per process, and roughly 0.07–0.08 ms of fixed Node + Express cost per request plus the payload work (JSON, zstd, BSON). Everything else — about 60–75% of a small request — is Nest, telemetry, our code and driver overhead, which is not a Node limit.
Today vs optimised, by where the CPU goes
CPU milliseconds per request, split by what the CPU was doing. Both builds profiled on the same lab pod; each category's share of busy time × that build's clean (unprofiled) CPU per request. Categories under 2% on both sides are hidden; the total row is the measured pod CPU.
Watch-list page: 3.18 → 1.80 ms CPU per request
| Where the CPU goes | Today (ms) | Optimised (ms) | Saved (ms) |
|---|---|---|---|
| Our app code | 0.80 | 0.36 | −0.44 |
| Node runtime | 0.53 | 0.31 | −0.22 |
| Nest + Express | 0.50 | 0.32 | −0.18 |
| Telemetry (OTel) | 0.37 | 0.24 | −0.13 |
| Compression middleware (buffering + gzip/br) | 0.27 | 0.10 | −0.17 |
| Node http + sockets | 0.16 | 0.14 | −0.02 |
| GC | 0.18 | 0.11 | −0.07 |
| Mongo (BSON + driver) | 0.11 | 0.08 | −0.03 |
| Logging | 0.10 | 0.04 | −0.06 |
| Cache decode (zstd) | 0.07 | 0.03 | −0.04 |
| Total (pod CPU) | 3.18 | 1.80 | −1.38 (43%) |
Single title: 3.10 → 2.15 ms CPU per request
| Where the CPU goes | Today (ms) | Optimised (ms) | Saved (ms) |
|---|---|---|---|
| Our app code | 0.56 | 0.43 | −0.13 |
| Node runtime | 0.56 | 0.41 | −0.15 |
| Nest + Express | 0.54 | 0.43 | −0.11 |
| Telemetry (OTel) | 0.39 | 0.22 | −0.17 |
| Mongo (BSON + driver) | 0.37 | 0.13 | −0.24 |
| Node http + sockets | 0.17 | 0.14 | −0.03 |
| GC | 0.15 | 0.12 | −0.03 |
| Compression middleware (buffering + gzip/br) | 0.12 | 0.11 | −0.01 |
| Logging | 0.11 | 0.04 | −0.07 |
| ETag / JWT hashing | 0.06 | 0.06 | 0 |
| Total (pod CPU) | 3.10 | 2.15 | −0.95 (31%) |
Watch-history display: 4.12 → 2.32 ms CPU per request
| Where the CPU goes | Today (ms) | Optimised (ms) | Saved (ms) |
|---|---|---|---|
| Mongo (BSON + driver) | 1.10 | 0.56 | −0.54 |
| Node runtime | 0.79 | 0.45 | −0.34 |
| Nest + Express | 0.81 | 0.38 | −0.43 |
| Telemetry (OTel) | 0.38 | 0.26 | −0.12 |
| GC | 0.31 | 0.16 | −0.16 |
| Our app code | 0.23 | 0.18 | −0.05 |
| Node http + sockets | 0.19 | 0.16 | −0.03 |
| ETag / JWT hashing | 0.11 | 0.05 | −0.06 |
| Logging | 0.09 | 0.04 | −0.05 |
| Compression middleware (buffering + gzip/br) | 0.07 | 0.05 | −0.02 |
| Total (pod CPU) | 4.12 | 2.32 | −1.80 (44%) |
Watch-history gates: 2.04 → 1.30 ms CPU per request
| Where the CPU goes | Today (ms) | Optimised (ms) | Saved (ms) |
|---|---|---|---|
| Nest + Express | 0.61 | 0.24 | −0.37 |
| Node runtime | 0.31 | 0.23 | −0.08 |
| Mongo (BSON + driver) | 0.26 | 0.23 | −0.03 |
| Telemetry (OTel) | 0.29 | 0.19 | −0.10 |
| Our app code | 0.22 | 0.14 | −0.07 |
| Node http + sockets | 0.13 | 0.11 | −0.02 |
| GC | 0.08 | 0.06 | −0.02 |
| Logging | 0.07 | 0.04 | −0.03 |
| Compression middleware (buffering + gzip/br) | 0.03 | 0.03 | 0 |
| Total (pod CPU) | 2.04 | 1.30 | −0.74 (36%) |
contentData: 2.39 → 0.95 ms CPU per request
| Where the CPU goes | Today (ms) | Optimised (ms) | Saved (ms) |
|---|---|---|---|
| Nest + Express | 0.66 | 0.16 | −0.50 |
| Mongo (BSON + driver) | 0.48 | 0.18 | −0.30 |
| Node runtime | 0.35 | 0.16 | −0.19 |
| Telemetry (OTel) | 0.31 | 0.15 | −0.16 |
| Our app code | 0.21 | 0.10 | −0.11 |
| Node http + sockets | 0.14 | 0.10 | −0.03 |
| GC | 0.12 | 0.05 | −0.07 |
| Logging | 0.08 | 0.03 | −0.05 |
| Total (pod CPU) | 2.39 | 0.95 | −1.44 (60%) |
Entitlement (play): 15.4 → 5.02 ms CPU per request
| Where the CPU goes | Today (ms) | Optimised (ms) | Saved (ms) |
|---|---|---|---|
| Device detection | 9.55 | 1.57 | −7.98 |
| Node runtime | 1.46 | 0.75 | −0.72 |
| Nest + Express | 0.95 | 0.65 | −0.30 |
| Telemetry (OTel) | 0.68 | 0.40 | −0.28 |
| Mongo (BSON + driver) | 0.52 | 0.35 | −0.18 |
| Our app code | 0.52 | 0.32 | −0.20 |
| Node http + sockets | 0.42 | 0.31 | −0.10 |
| Other npm | 0.32 | 0.28 | −0.04 |
| GC | 0.37 | 0.15 | −0.22 |
| Total (pod CPU) | 15.4 | 5.02 | −10.38 (67%) |
Page routes: 205.4 → 62.1 ms CPU per request
| Where the CPU goes | Today (ms) | Optimised (ms) | Saved (ms) |
|---|---|---|---|
| Our app code | 77.0 | 14.8 | −62.25 |
| Node runtime | 44.4 | 12.5 | −31.88 |
| GC | 22.6 | 5.90 | −16.69 |
| Nest + Express | 19.7 | 8.08 | −11.64 |
| Compression middleware (buffering + gzip/br) | 19.1 | 6.15 | −12.95 |
| Telemetry (OTel) | 6.98 | 3.91 | −3.07 |
| Cache decode (zstd) | 3.70 | 2.61 | −1.09 |
| Mongo (BSON + driver) | 3.29 | 1.68 | −1.61 |
| Node http + sockets | 2.47 | 1.99 | −0.48 |
| ETag / JWT hashing | 2.05 | 2.17 | +0.12 |
| Total (pod CPU) | 205.4 | 62.1 | −143.30 (70%) |
Flame graphs (final build)
One per route, collapsed — each is a tall image. Width = share of busy CPU; open the SVG directly to hover frames for names and milliseconds.
Single title flame graph
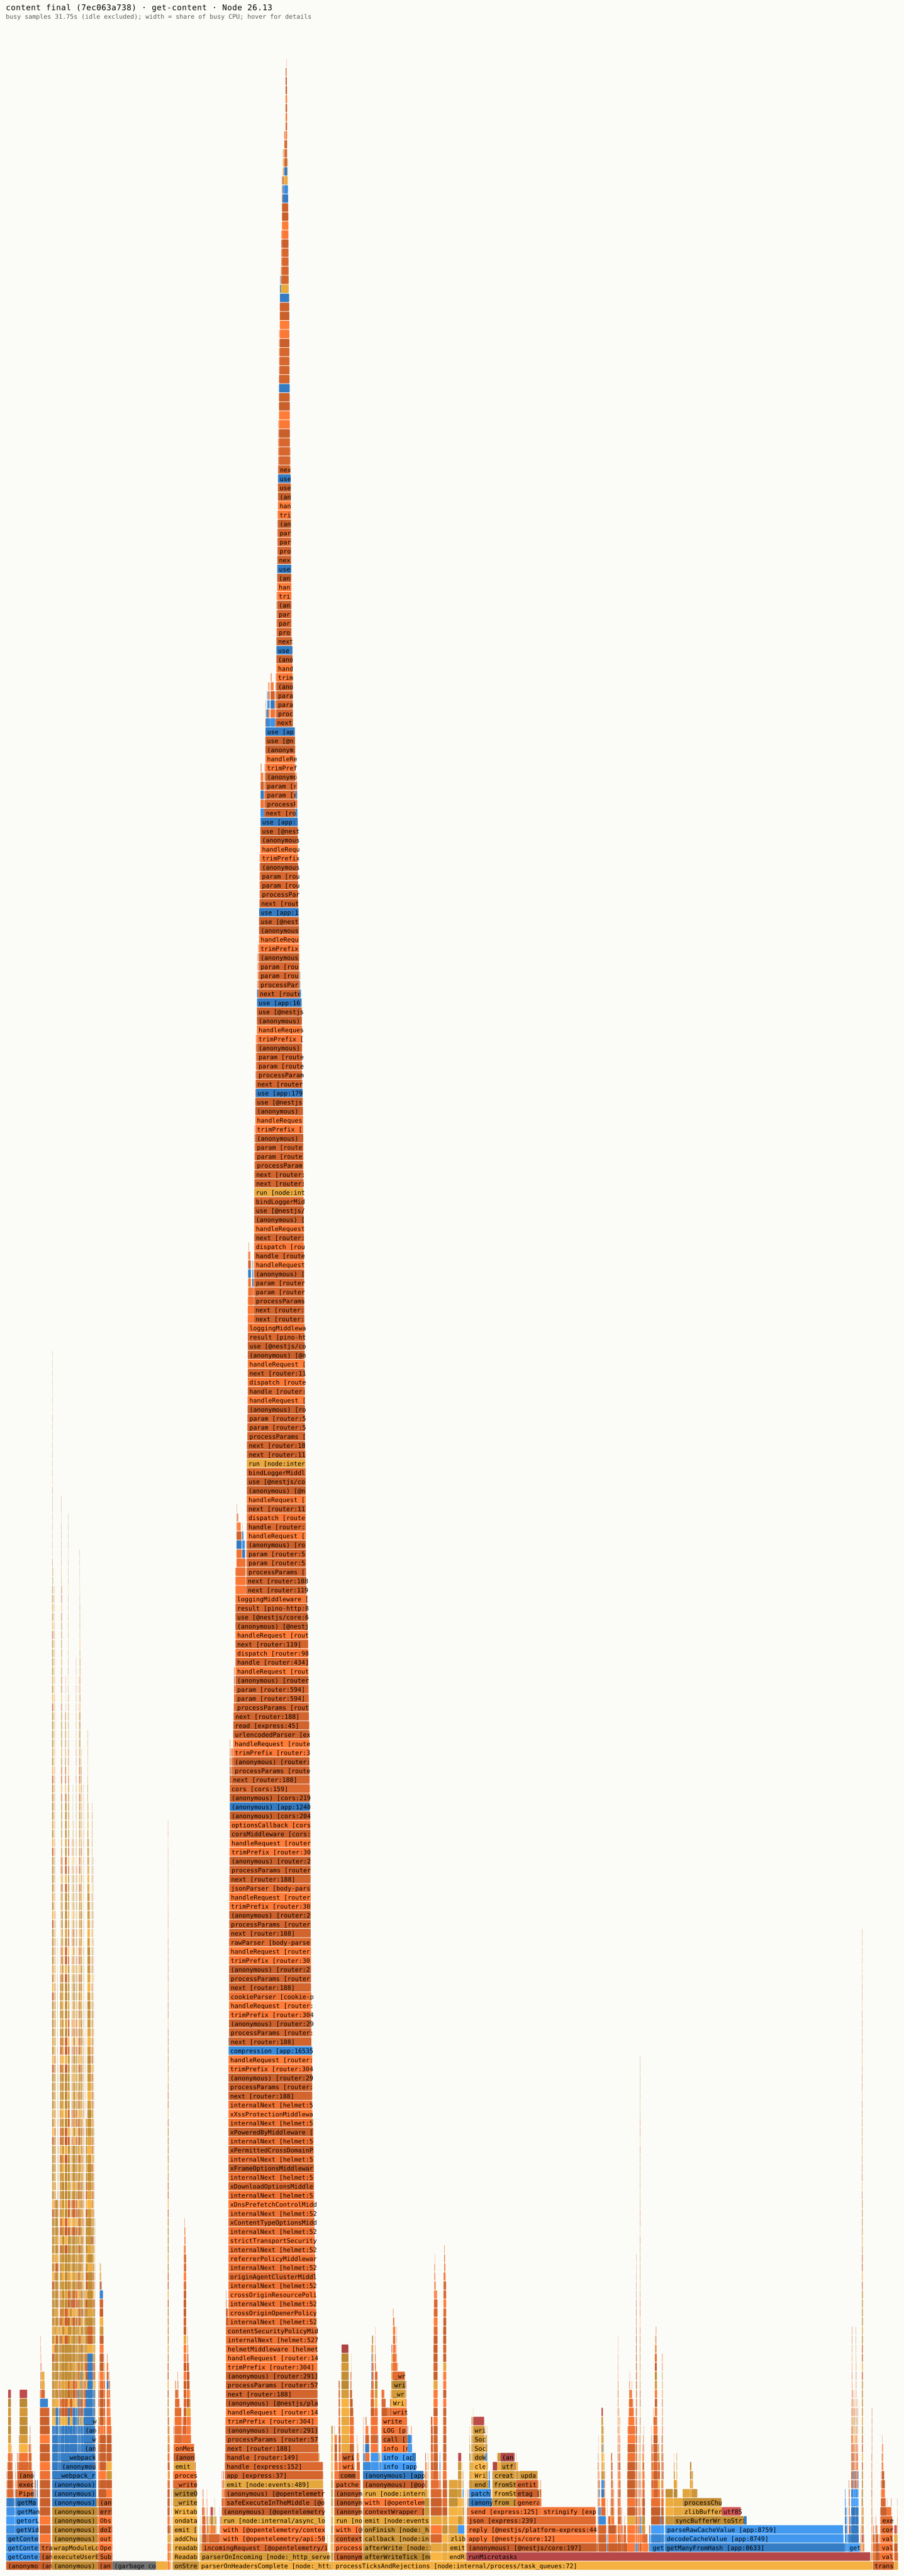
7ec063a738, Node 26.13. Open interactive SVG · speedscope + folded stacks kept in the lab (prof/FINAL-flame-get-content.*)Watch-list flame graph
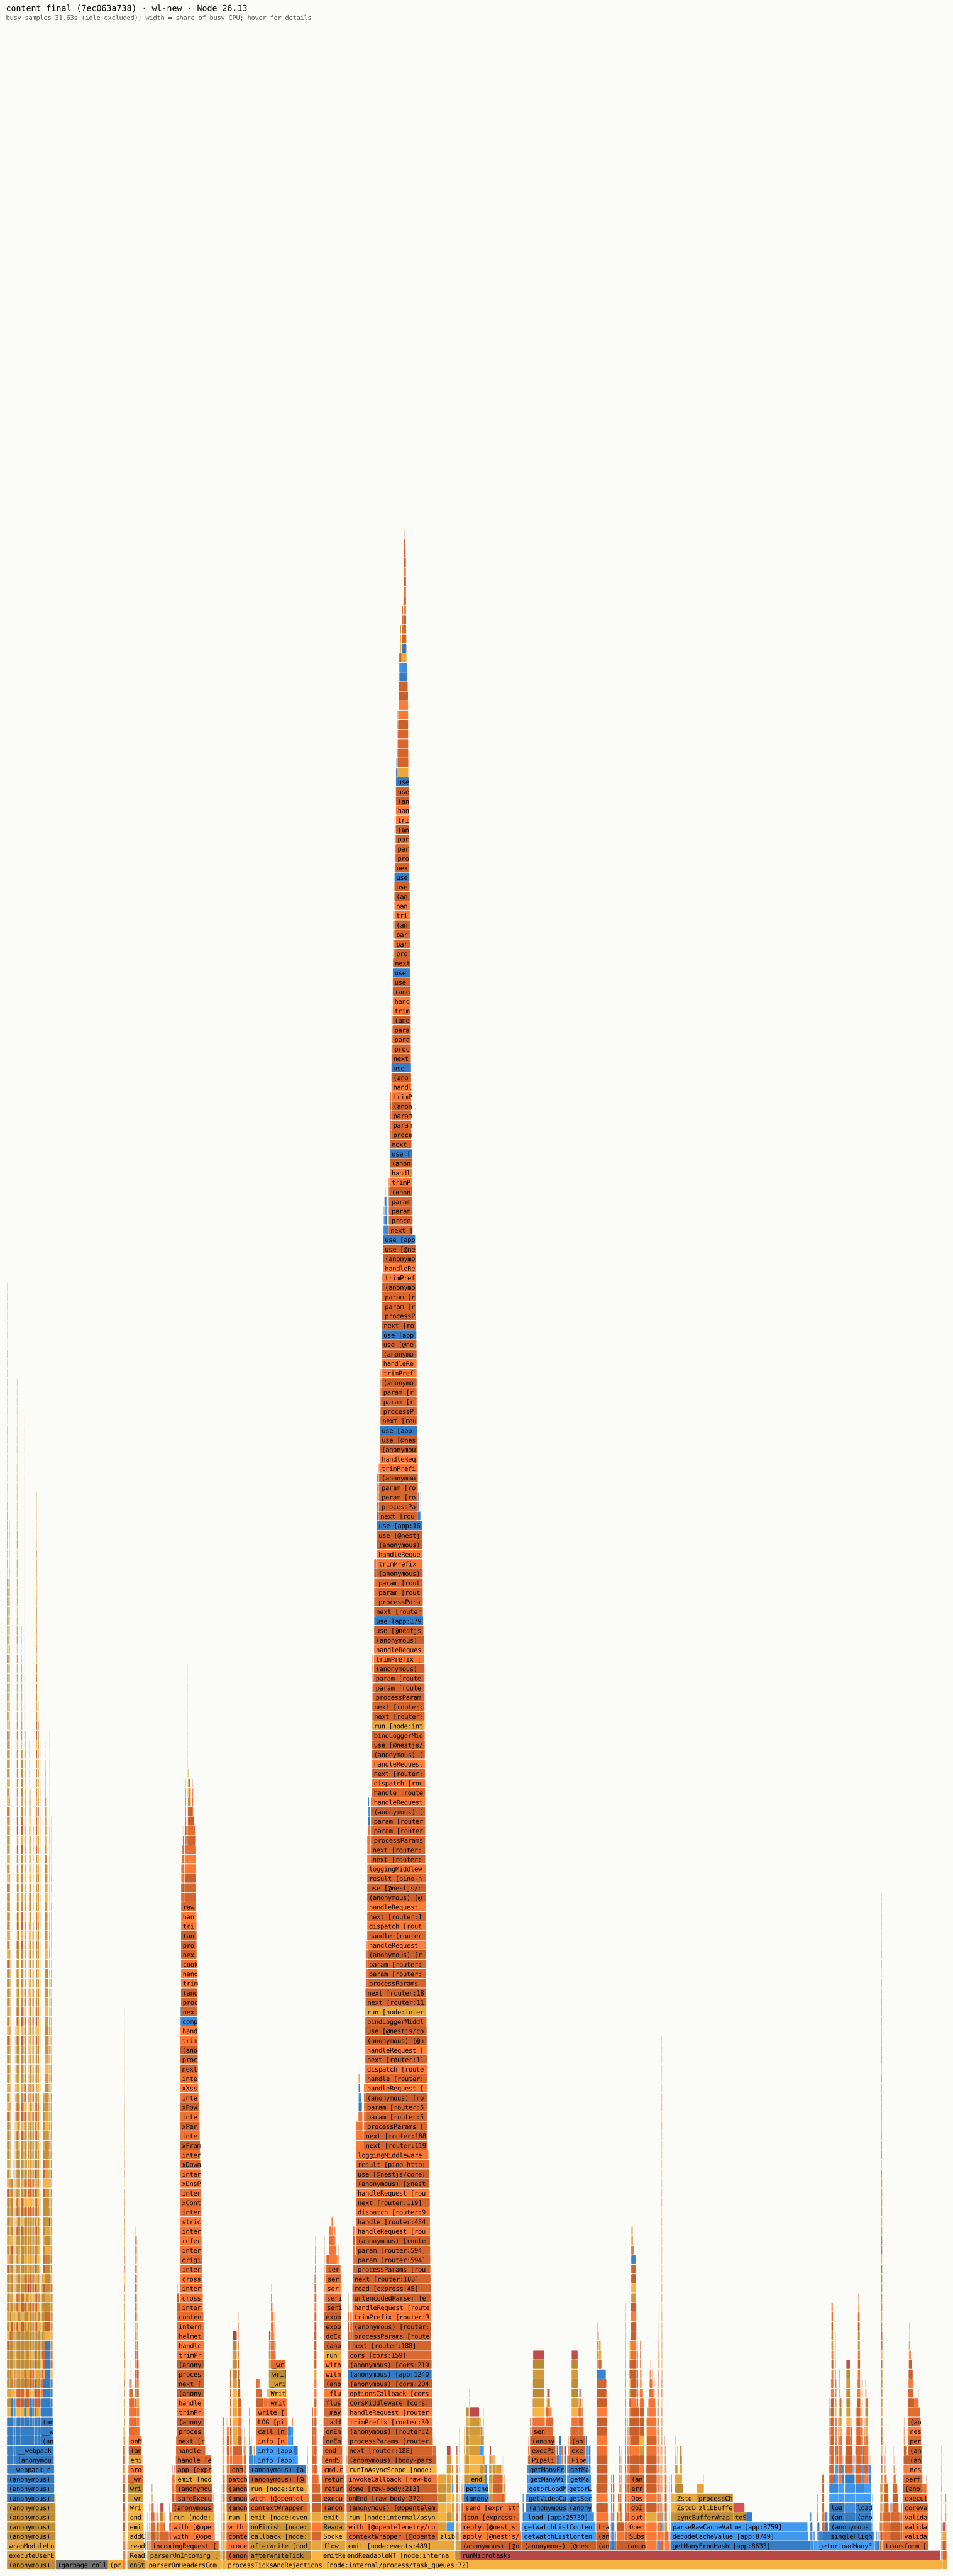
7ec063a738, Node 26.13. Open interactive SVG · speedscope + folded stacks kept in the lab (prof/FINAL-flame-wl-new.*)Watch-history display flame graph
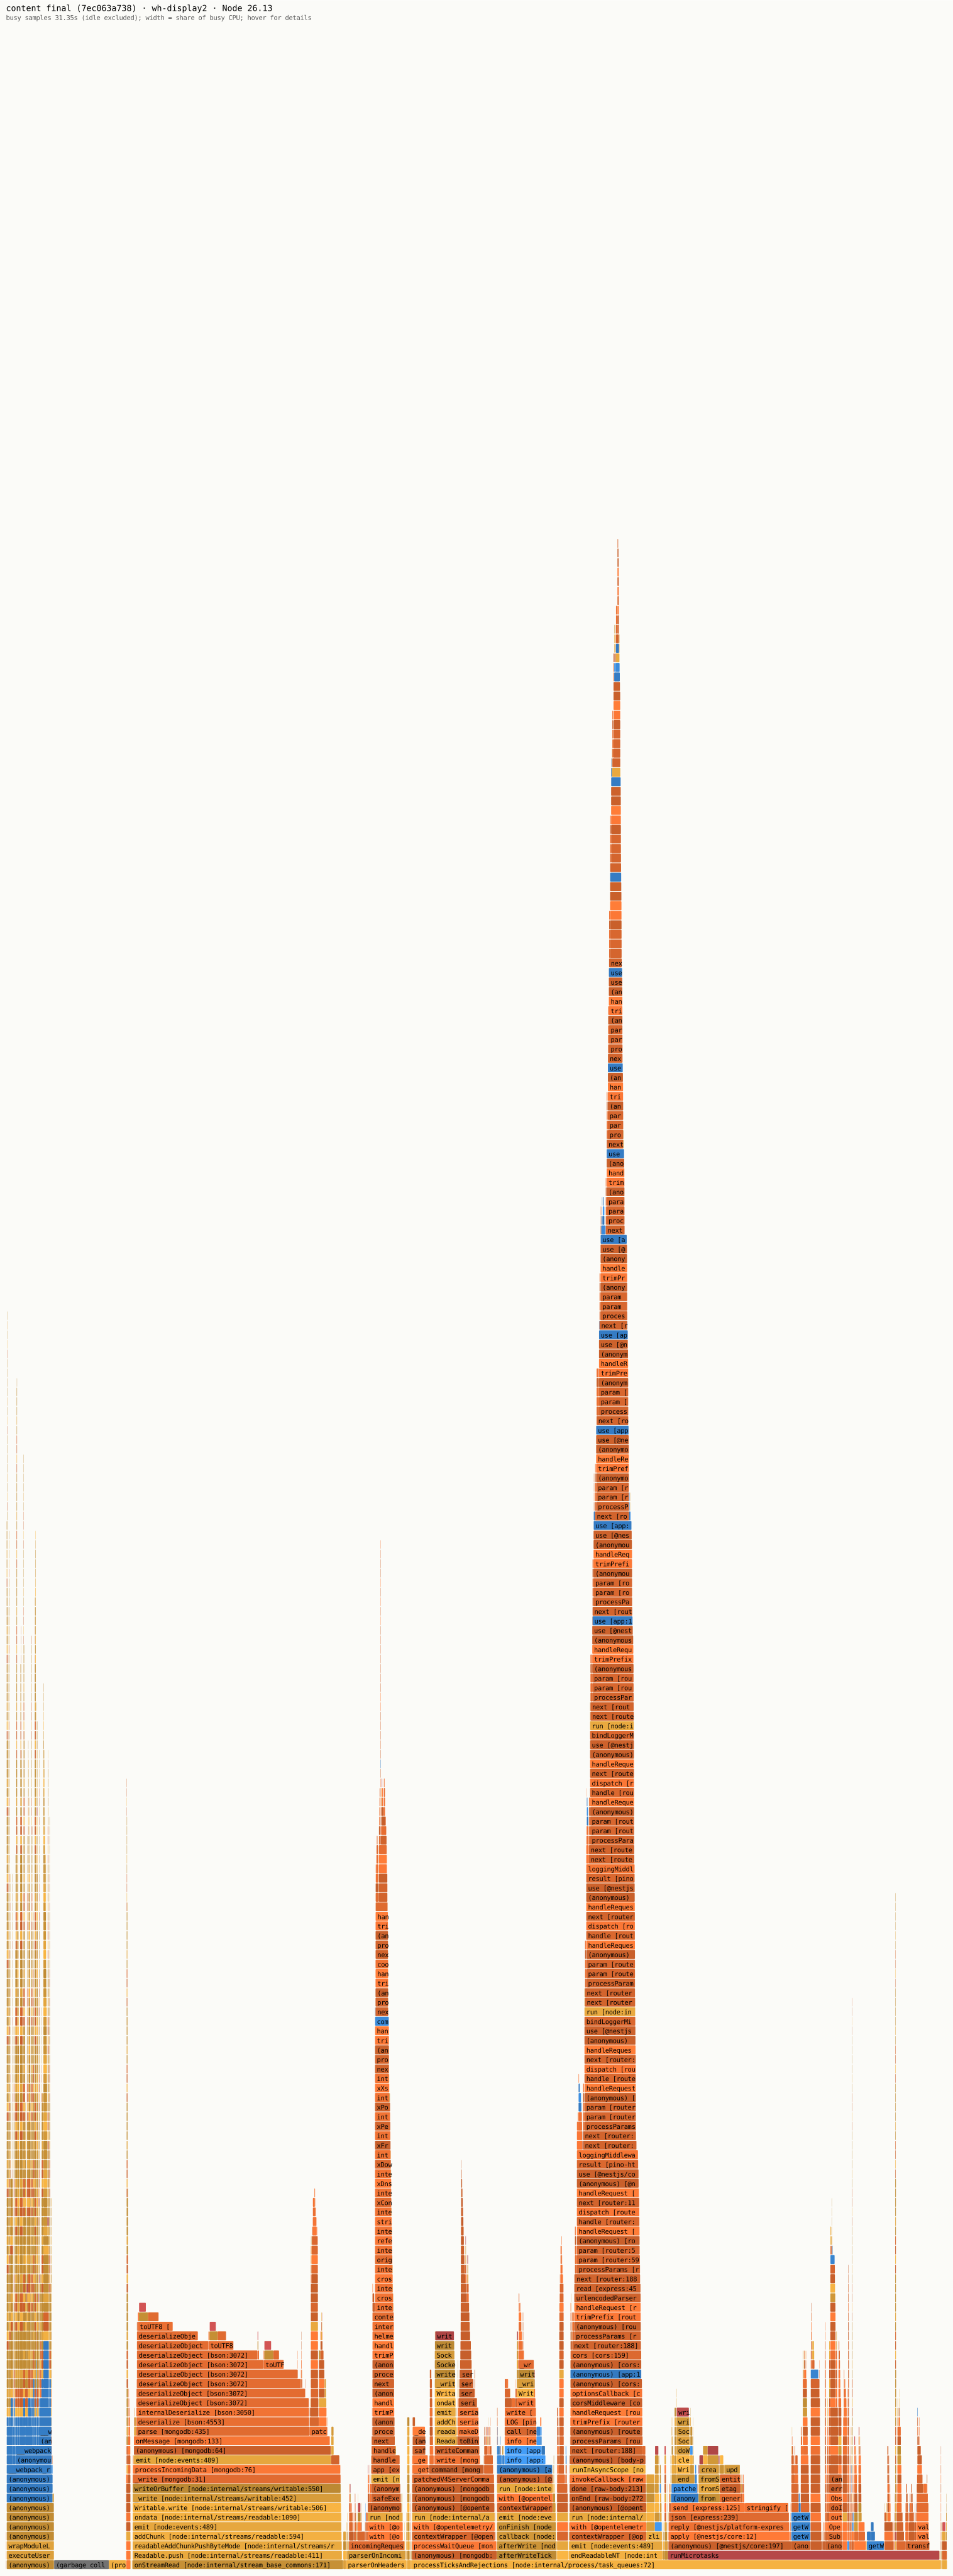
7ec063a738, Node 26.13. Open interactive SVG · speedscope + folded stacks kept in the lab (prof/FINAL-flame-wh-display2.*)Watch-history gates flame graph
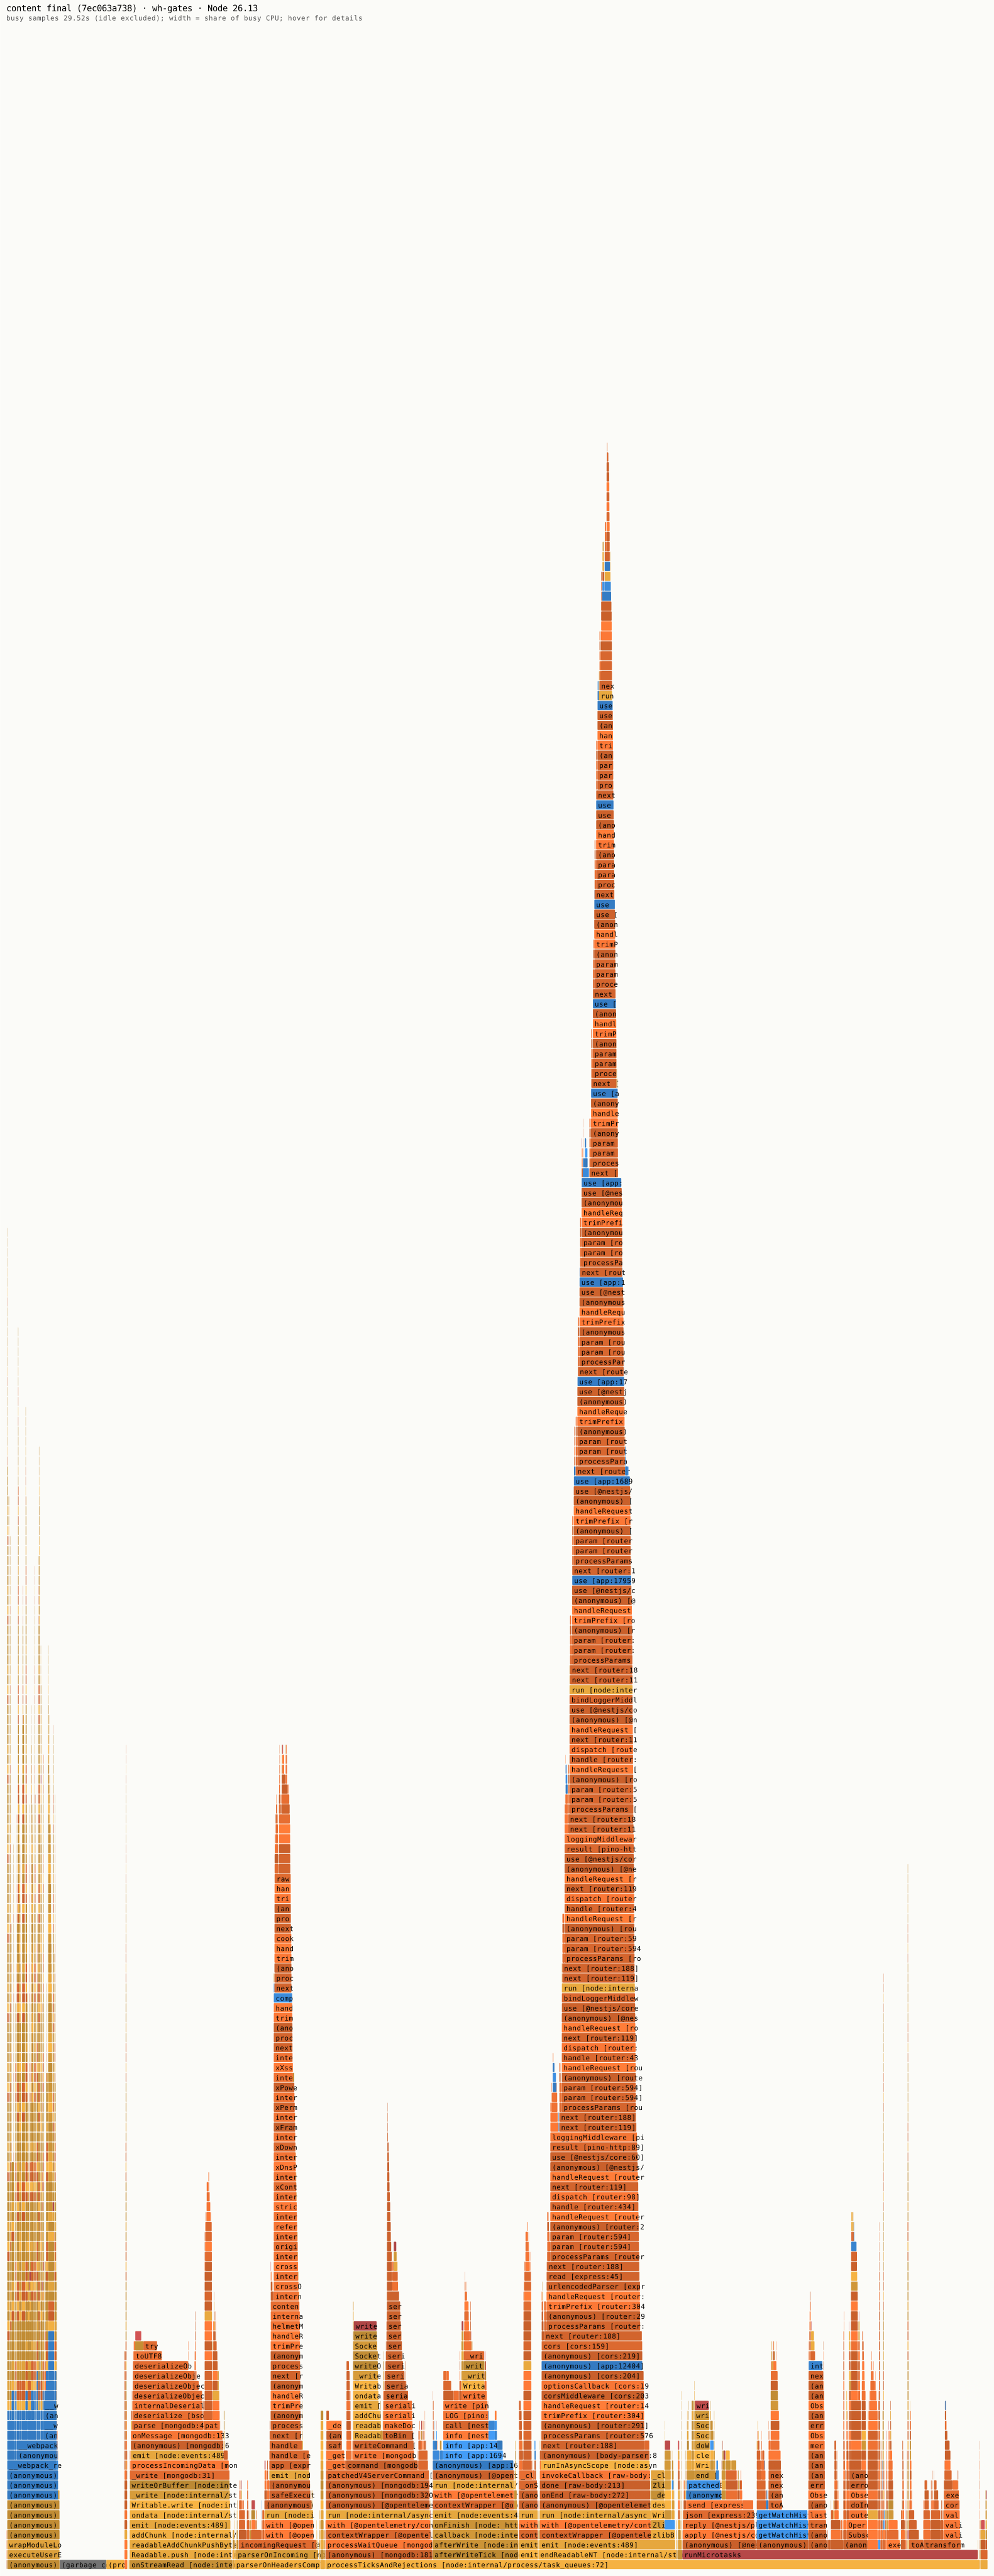
7ec063a738, Node 26.13. Open interactive SVG · speedscope + folded stacks kept in the lab (prof/FINAL-flame-wh-gates.*)contentData flame graph
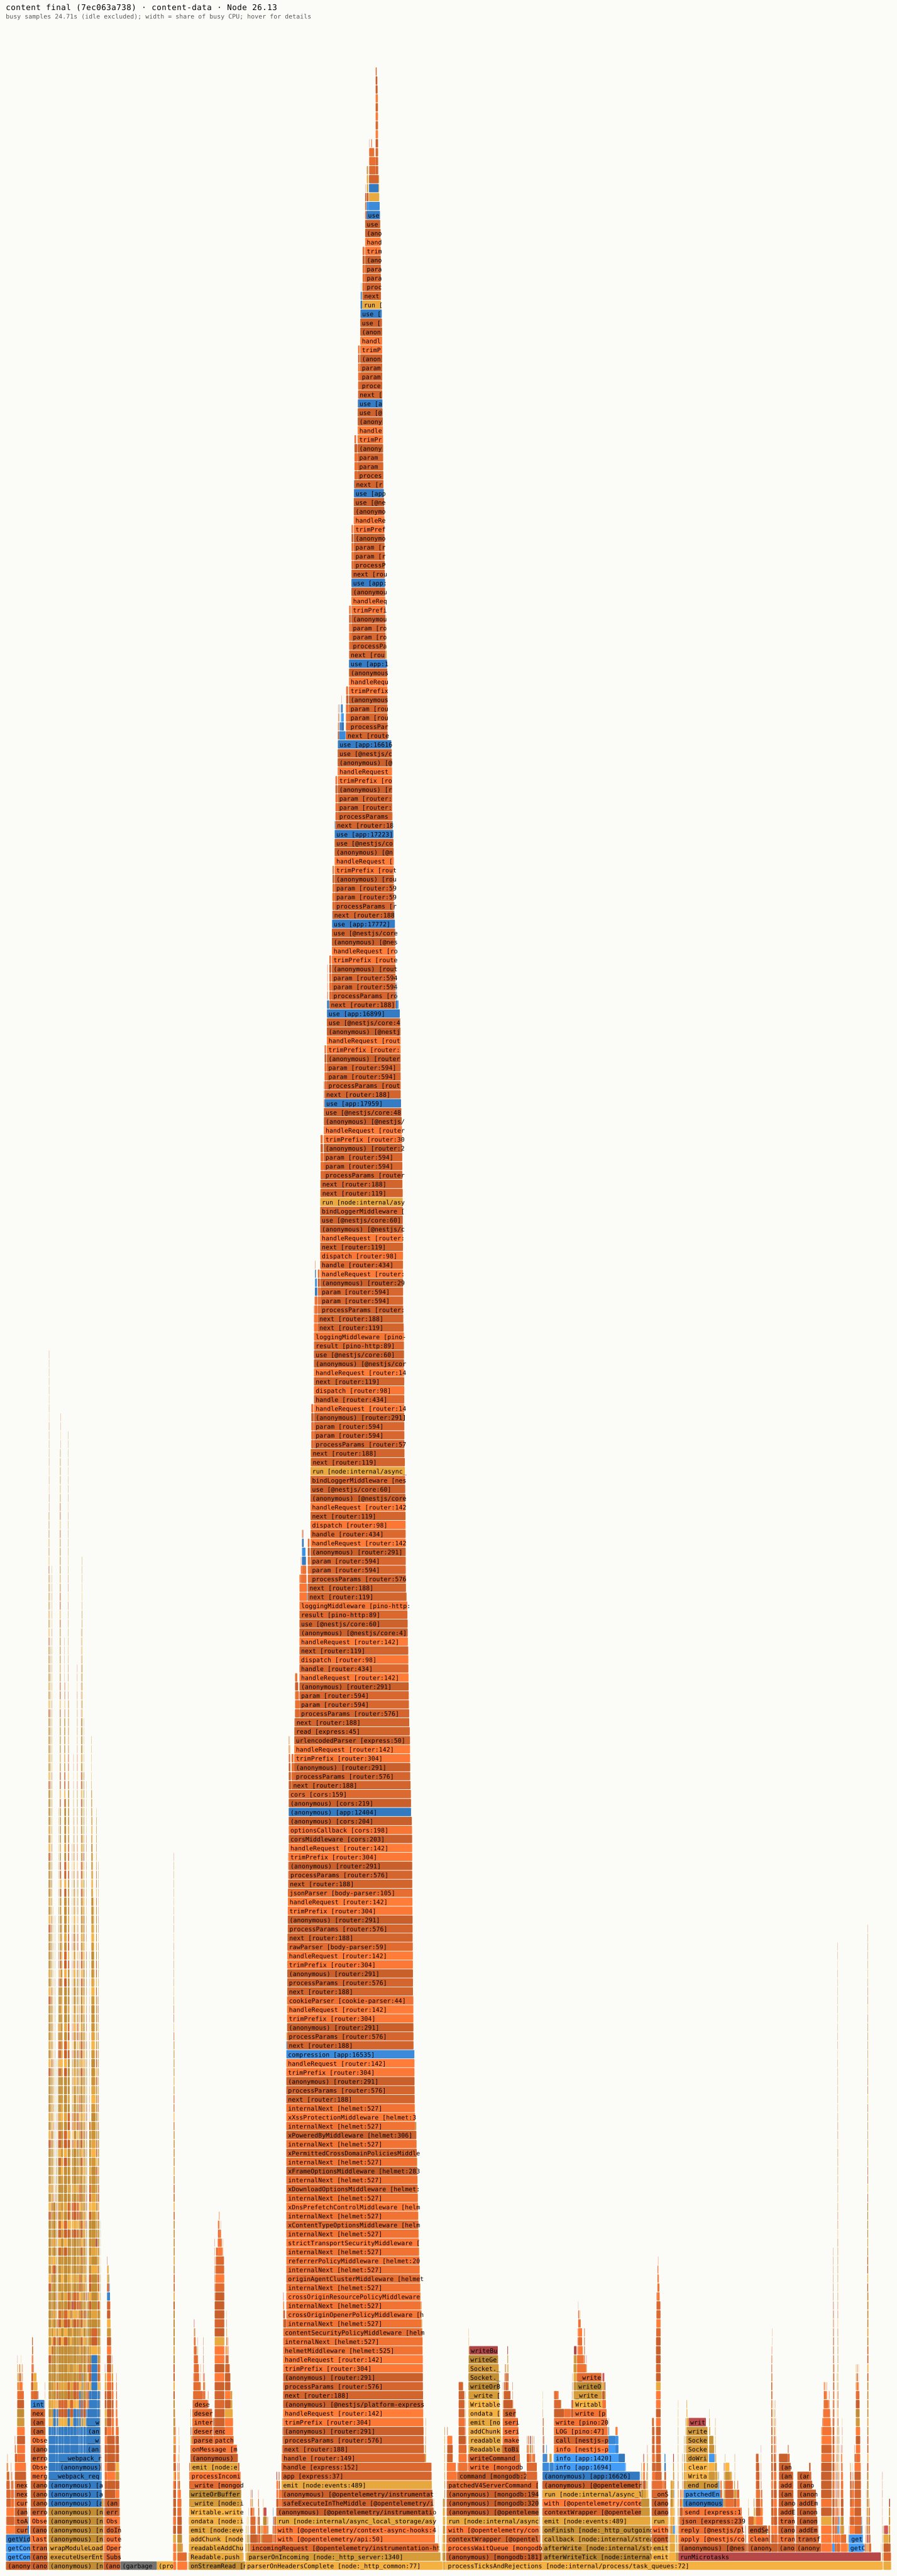
7ec063a738, Node 26.13. Open interactive SVG · speedscope + folded stacks kept in the lab (prof/FINAL-flame-content-data.*)Entitlement flame graph
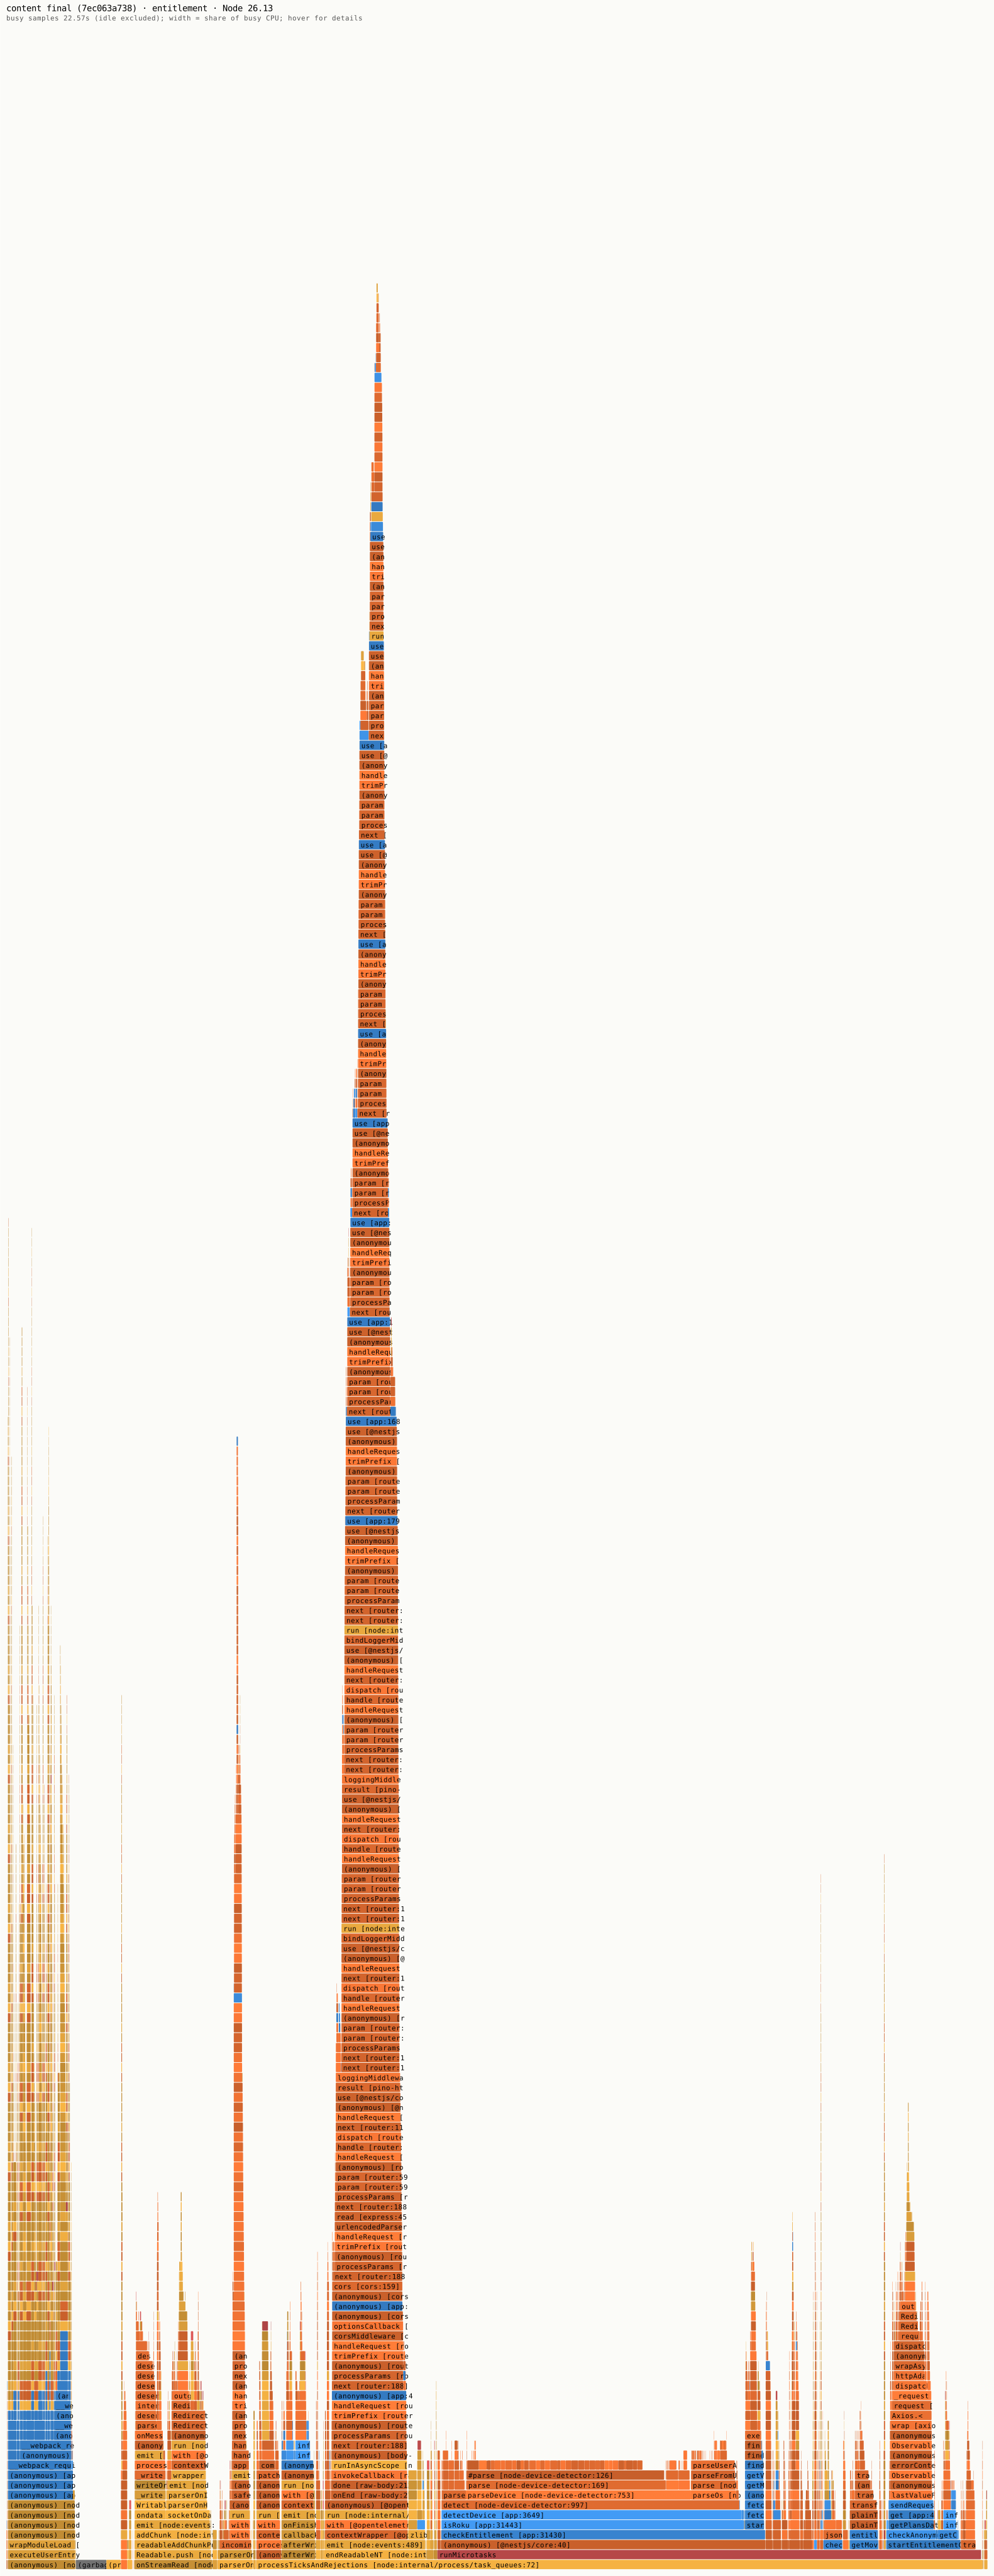
7ec063a738, Node 26.13. Open interactive SVG · speedscope + folded stacks kept in the lab (prof/FINAL-flame-entitlement.*)Pages flame graph
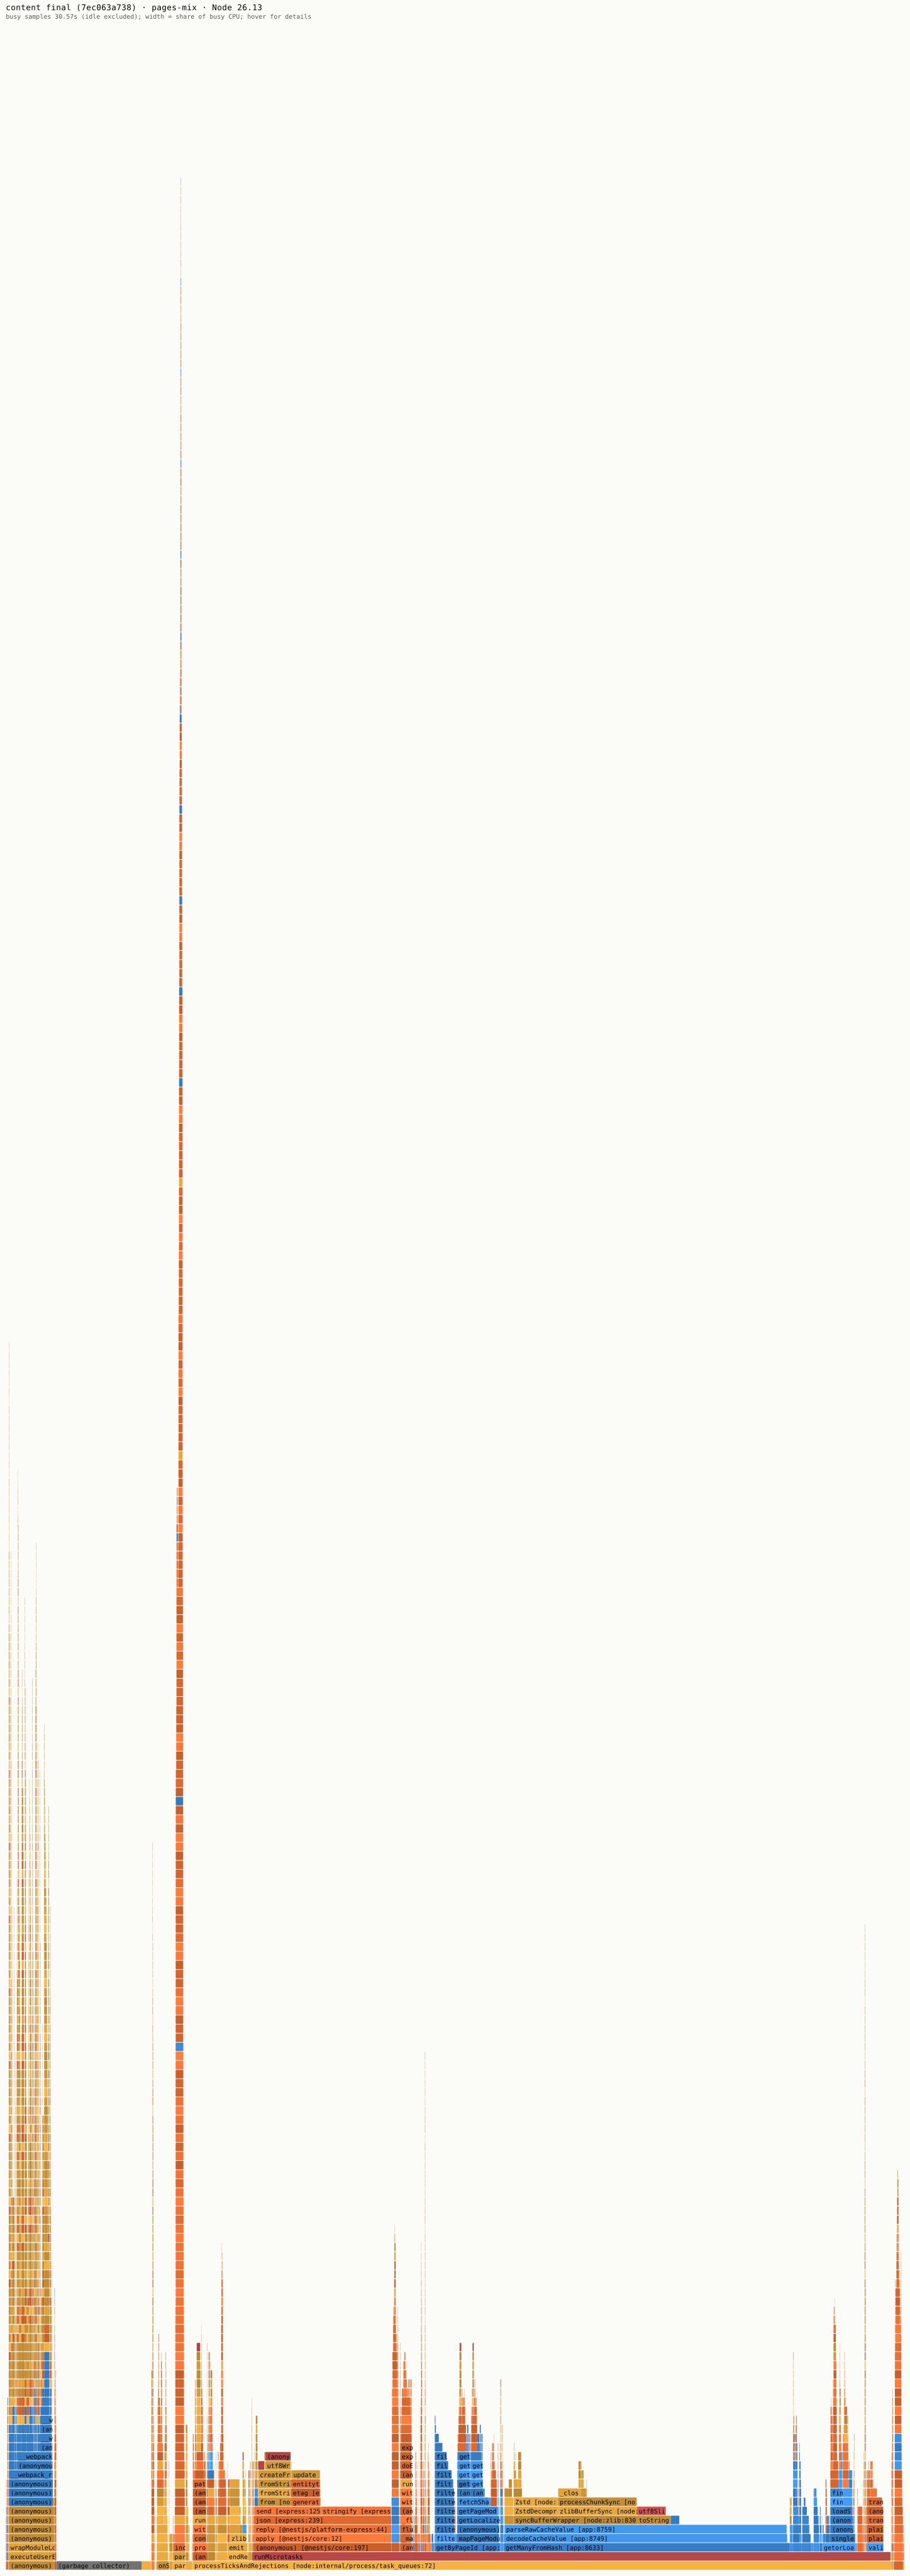
7ec063a738, Node 26.13. Open interactive SVG · speedscope + folded stacks kept in the lab (prof/FINAL-flame-pages-mix.*)Why hundreds of requests per second, not thousands
Short answer
Bun's and NestJS's headline numbers are real on this same pod: a bare server answers a request in about 17 µs of CPU (~58,000 req/s per core). Our requests do 50–100× more work — move 10–70 KB of JSON (pages: 1–6 MB) out of a cache or Mongo, run a stack of middleware, and trace every request. The ceiling is the work and the per-request stack, not Node or Nest.
The ladder: what each layer costs (/health, CPU µs per request)
| Layer | CPU per request | ≈ req/s per core | What it adds |
|---|---|---|---|
Bare node:http | 17 µs | ~58,000 | Parse request, write response, socket |
| Minimal Nest on NodeAdapter (0 middleware) | 19 µs | ~53,000 | Nest's router + DI — NestJS's claim holds: ≈ raw Node |
| Bare Express | 37 µs | ~27,000 | Express routing (+20 µs over raw) |
| Minimal Nest on Express | 39 µs | ~26,000 | Same as bare Express: Nest adds ~2 µs |
| Our app, NodeAdapter, telemetry off | 124 µs | ~8,000 | +24 µs app wiring/pino-http, +81 µs our middleware stack |
| Our app, NodeAdapter, telemetry on | 188 µs | ~5,300 | +64 µs OpenTelemetry |
Same pod type and 2-CPU limit as prod, 3 interleaved rounds, process environment checked on every run (raw data). The request is a ~15-byte health check, so this is pure per-request overhead.
On a real route: what the stack costs
Watch-list page as core calls it (uncompressed): 1.65 ms of CPU per request on the build tested. Each row removes one piece in a lab-only build and measures the saving, 3 interleaved rounds — what each piece costs, not an estimate. Removals overlap, so the rows don't add up exactly.
| Piece | CPU per request | Share | Needed? |
|---|---|---|---|
| OpenTelemetry (spans, context, export) | 0.47 ms | 29% | Yes — 10% sampling + no pino instrumentation recovers about half |
Request logger ([RES] line + its context) | 0.19 ms | 11% | The [RES] line yes; building its context reads req.query ~9× per call |
| ValidationPipe (class-validator / transformer) | 0.14 ms | 8% | Yes, at the trust boundary |
| Interceptors (timeout, cache-control) | 0.10 ms | 6% | Yes |
| Express vs NodeAdapter (the adapter itself) | 0.05 ms | 3% | Swappable |
| Compression middleware | ~0 | noise | In-cluster callers already ask for uncompressed replies |
| What's left: the work (cache read, zstd, JSON, Mongo, our logic, Nest core) | ~0.7 ms | ~43% | This is the route |
For browser and app clients that send Accept-Encoding: gzip, br, in-pod compression is the single biggest piece: −37% on single title, −24% on watch-list when removed. Express 5 also re-parses the query string on every req.query read (~20 parses per GET vs 1 on NodeAdapter). Source: NodeAdapter lane removal runs (na-abl-id-wl-new.jsonl, na-abl-get-content.jsonl, na-abl-wl-new.jsonl).
Per route: the ceiling, and how far it can go
| Route | Response size | CPU per request (optimised) | Max req/s per core | One pod, 2 threads (measured) | Same route, no framework (measured) |
|---|---|---|---|---|---|
| contentData | 0.5 KB | 0.95 ms | ~1,050 | 1,910 | 4,350 req/s (0.18 ms) |
| Watch-list page | 13 KB | 1.80 ms | ~550 | 1,046 | 2,026 req/s (0.57 ms) |
| Single title | 72 KB | 2.15 ms | ~465 | 875 | 1,084 req/s (1.14 ms) |
| Watch-history gates | 9 KB | 1.30 ms | ~770 | 1,266 | 1,295 req/s (0.45 ms) |
| Page routes | ~190 KB median (WEB pages up to 6 MB) | 62 ms | ~16 | 29 | — |
Is it good enough?
- Prod content peaked at ~76 req/s this week across all pods (7-day max, 400 s buckets).
- One optimised pod now handles ~460 req/s on the prod route mix on one thread, ~675 on two.
- The 504s came from the watch-list fan-out (18 content calls per page) and CPU-heavy requests queueing — both fixed in PR #4593.
Is it 'standard'?
- We found no sourced benchmark for Nest + Express apps serving 10–70 KB JSON from a database, so there is no external yardstick here.
- Our own comparison: the same routes without the framework stack do 2–3.5× the req/s with identical responses.
- Payload size dominates: JSON and socket work scale with bytes; a 72 KB reply costs ~70× a 1 KB one.
Biggest levers, in order
- Smaller payloads — send cards, not full title objects, where clients only need cards.
- Lighter per-request stack — compression off the event loop, sampled telemetry, one logger.
- Use both CPUs — 2 threads per pod.
- Framework-free hot routes — 2–3.5× req/s, at the cost of a second code path.
- Runtime (Bun) — −4% to −27% CPU per request with telemetry on, +100–300 MiB memory.
Telemetry's real cost
Same final build, telemetry as shipped vs OTEL_SDK_DISABLED=true, 3 interleaved rounds, process environment checked on every run. An earlier pass measured export as free; it was invalid — the lab's restart loop leaked env vars between runs, so its 'telemetry on' arms ran with tracing off. That loop is fixed and every run now records its environment.
| Route | Encoding | CPU ms shipped | OTel off | Change | Verdict | req/s |
|---|---|---|---|---|---|---|
| contentData | uncompressed | 0.94 | 0.71 | −24% | beyond spread | 1170 → 1535 |
| Single title | compressed | 2.98 | 2.79 | −6% | beyond spread | 490 → 528 |
| Single title | uncompressed | 2.49 | 2.15 | −14% | beyond spread | 503 → 573 |
| Watch-history display | uncompressed | 2.41 | 2.07 | −14% | beyond spread | 500 → 573 |
| Watch-list page | uncompressed | 1.80 | 1.39 | −23% | beyond spread | 643 → 826 |
Other runtimes and compilers
Five parallel lanes, each on its own node, every claim re-checked against the raw files by a separate agent. Full record: lab/results/RUNTIME-FLOOR-FINDINGS.md.
Bun 1.4.4 vs Node 26.13 on the same build (PR #4593 plus the stacked Bun fixes, commit 6c1be0052b), telemetry on for both, patched detector on both, one lab pod, 3 interleaved rounds, binary and bundle checked on every run, 0 failed requests. Bun used less CPU in 21 of 21 paired rounds.
| Route | Node ms/req | Bun ms/req | CPU change | Bun lower (rounds) | req/s | p99 ms | RSS MiB |
|---|---|---|---|---|---|---|---|
| Watch-list page | 1.96 | 1.57 | -20% | 3/3 | 613 → 728 | 60 → 51 | 341 → 441 |
| Single title | 2.46 | 2.08 | -15% | 3/3 | 493 → 554 | 70 → 56 | 343 → 495 |
| Watch-history display | 2.69 | 2.58 | -4% | 3/3 | 454 → 443 | 79 → 68 | 332 → 490 |
| Watch-history gates | 1.50 | 1.25 | -17% | 3/3 | 792 → 880 | 48 → 41 | 327 → 480 |
| contentData | 1.07 | 0.81 | -24% | 3/3 | 1090 → 1319 | 31 → 28 | 331 → 453 |
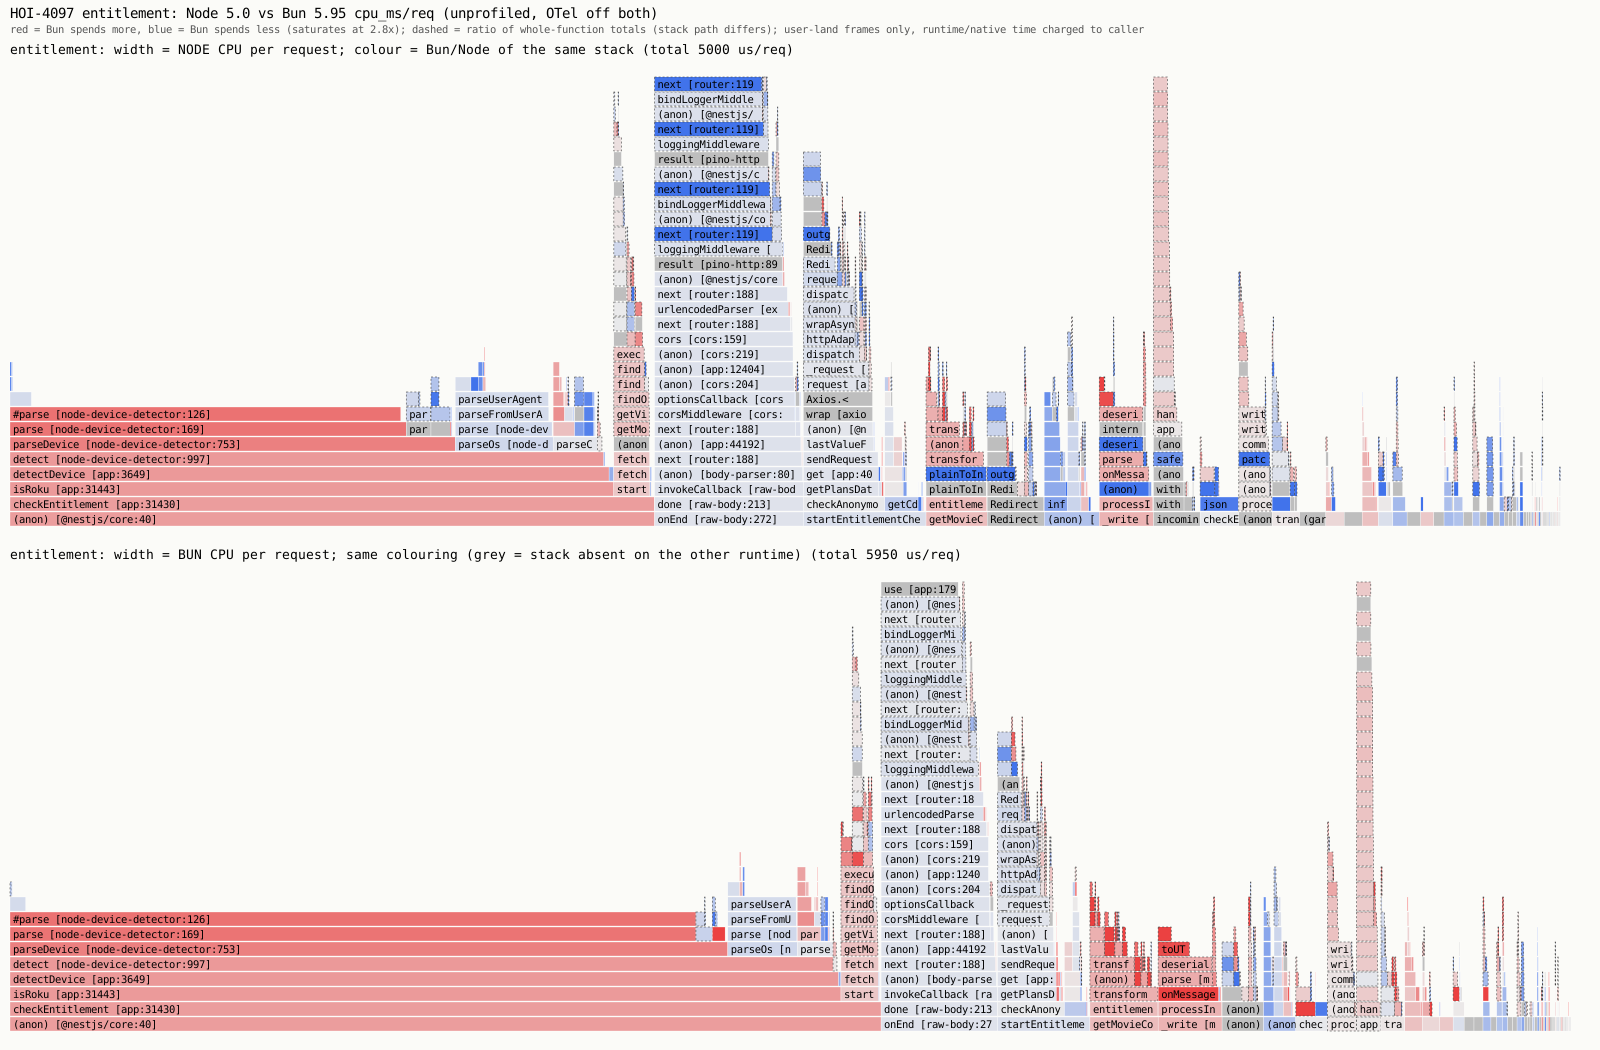
| Entitlement (play) | 5.38 | 5.04 | -6% | 3/3 | 216 → 230 | 157 → 153 | 363 → 486 |
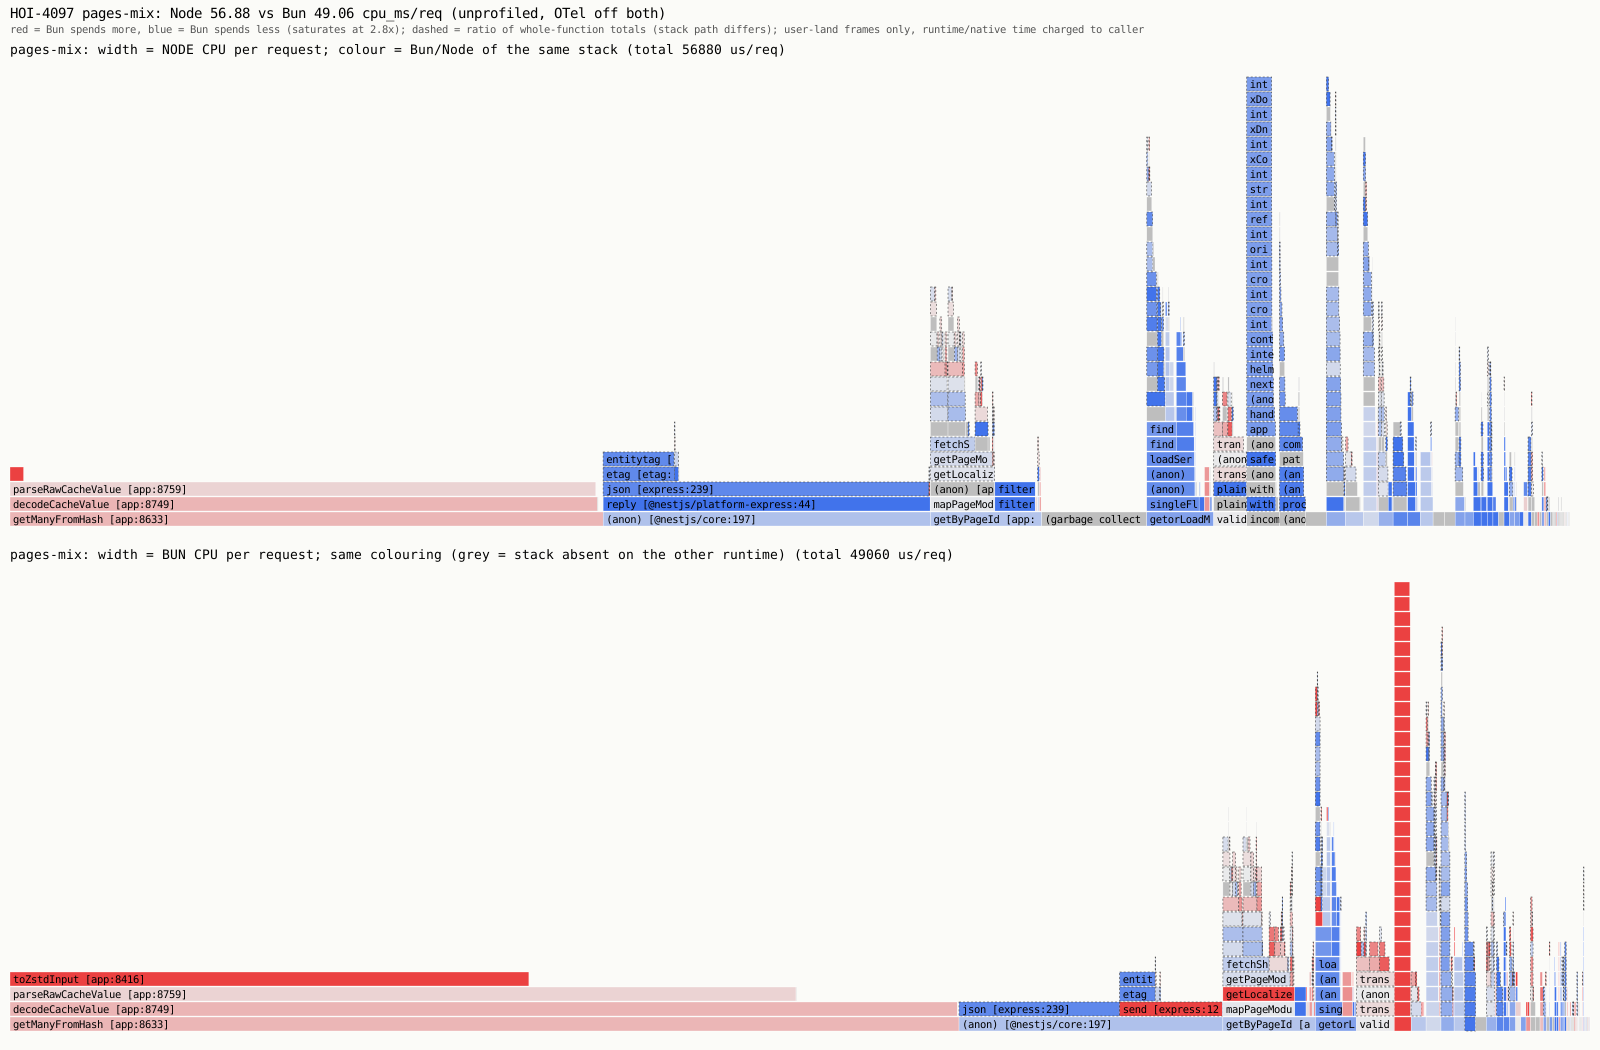
| Page routes | 63.48 | 46.32 | -27% | 3/3 | 24 → 31 | 484 → 413 | 438 → 743 |
What it took (stacked branch)
- Entitlement regression fixed: the detector patch repeated a 5-way prefix 64× per regex; JavaScriptCore's regex engine handles that ~3× worse than V8. Matching the prefix once: Bun −39.5%, Node −19.6%, identical output on 40,266 user agents (now in PR #4593).
- Tracing works on Bun:
https.Serverinheritshttp.Server'semiton Bun, so the OTel https patch unwrapped the http one.isolateHttpsServerEmitfixes it: same spans and trace headers as Node, 0 mismatches on 4,846 requests. - Cache codec copy:
Uint8Array.frombefore zstd cost 207 µs/req on Bun vs 12 on Node (watch-list). Removed: Bun −12% to −18%, Node unchanged. - Geo lookup: native mmap-io doesn't load on Bun; replaced by
Bun.mmap, identical results on 1,000 IPs.
Costs and open items
- Memory +100 to +300 MiB per pod (pages 438 → 743 MiB). Limits need raising before a switch.
- Watch-history display and entitlement gain least (−4%, −6%): Mongo/BSON and regex-bound, where JavaScriptCore isn't faster.
- Before switching: SigNoz delivery verified end to end, 24 h UAT soak, memory limits raised. Node stays the default; the image can run either.
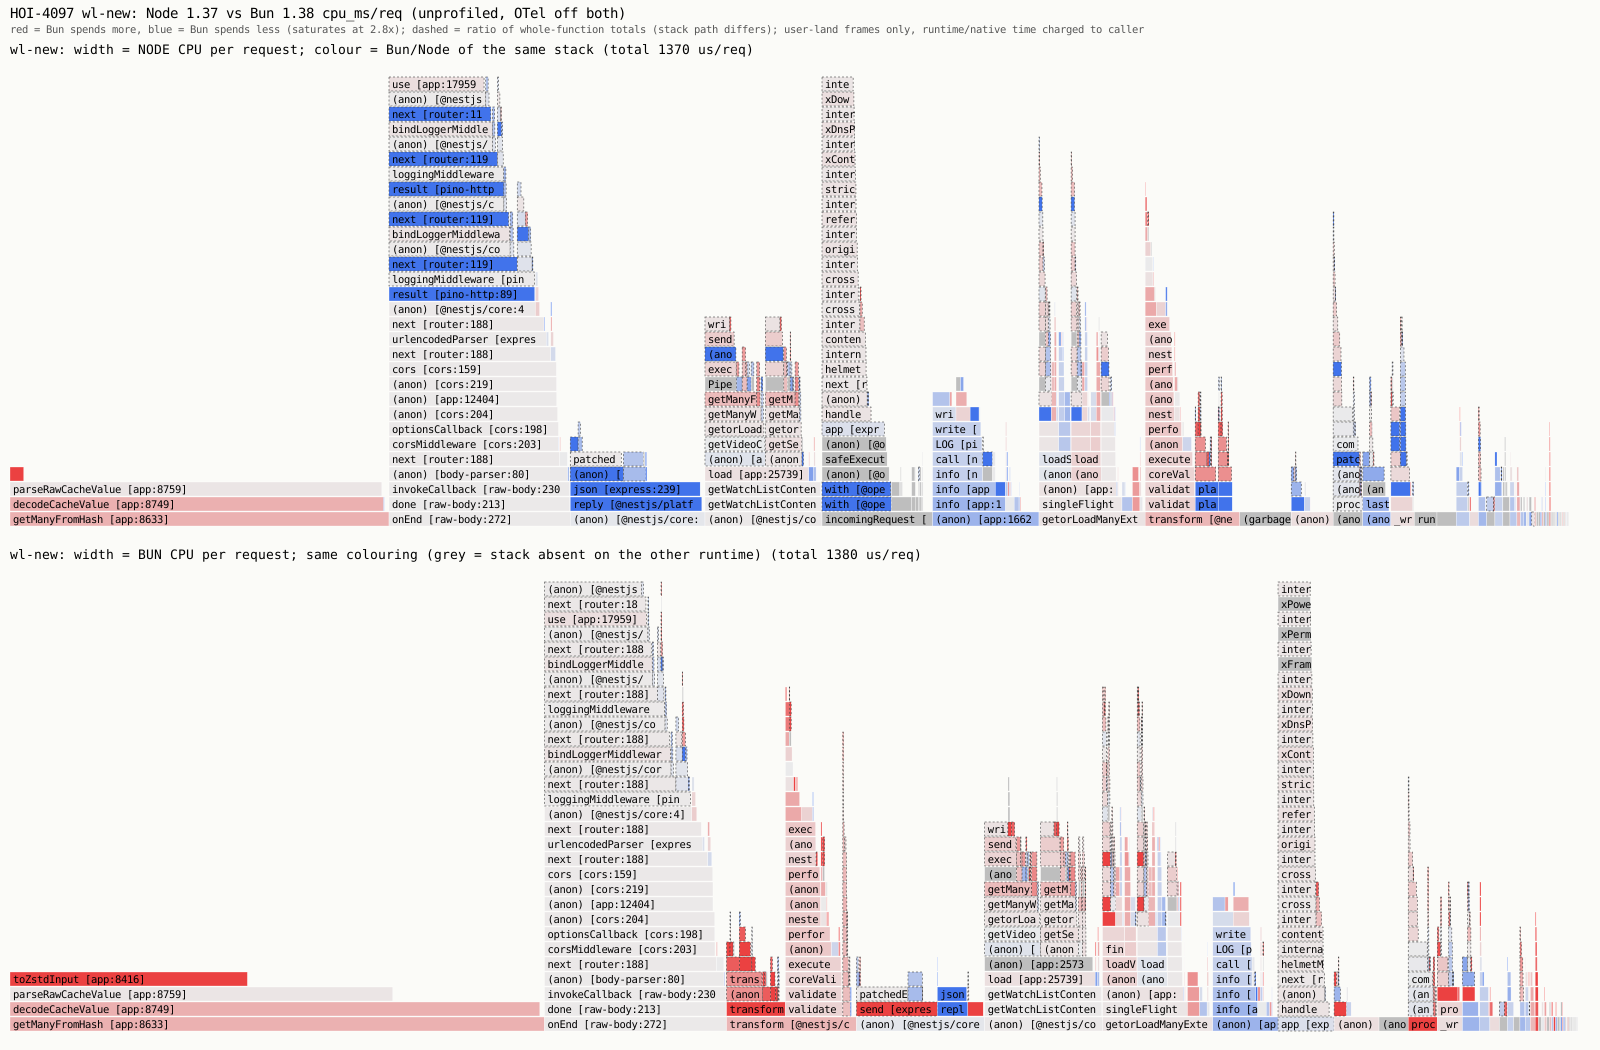
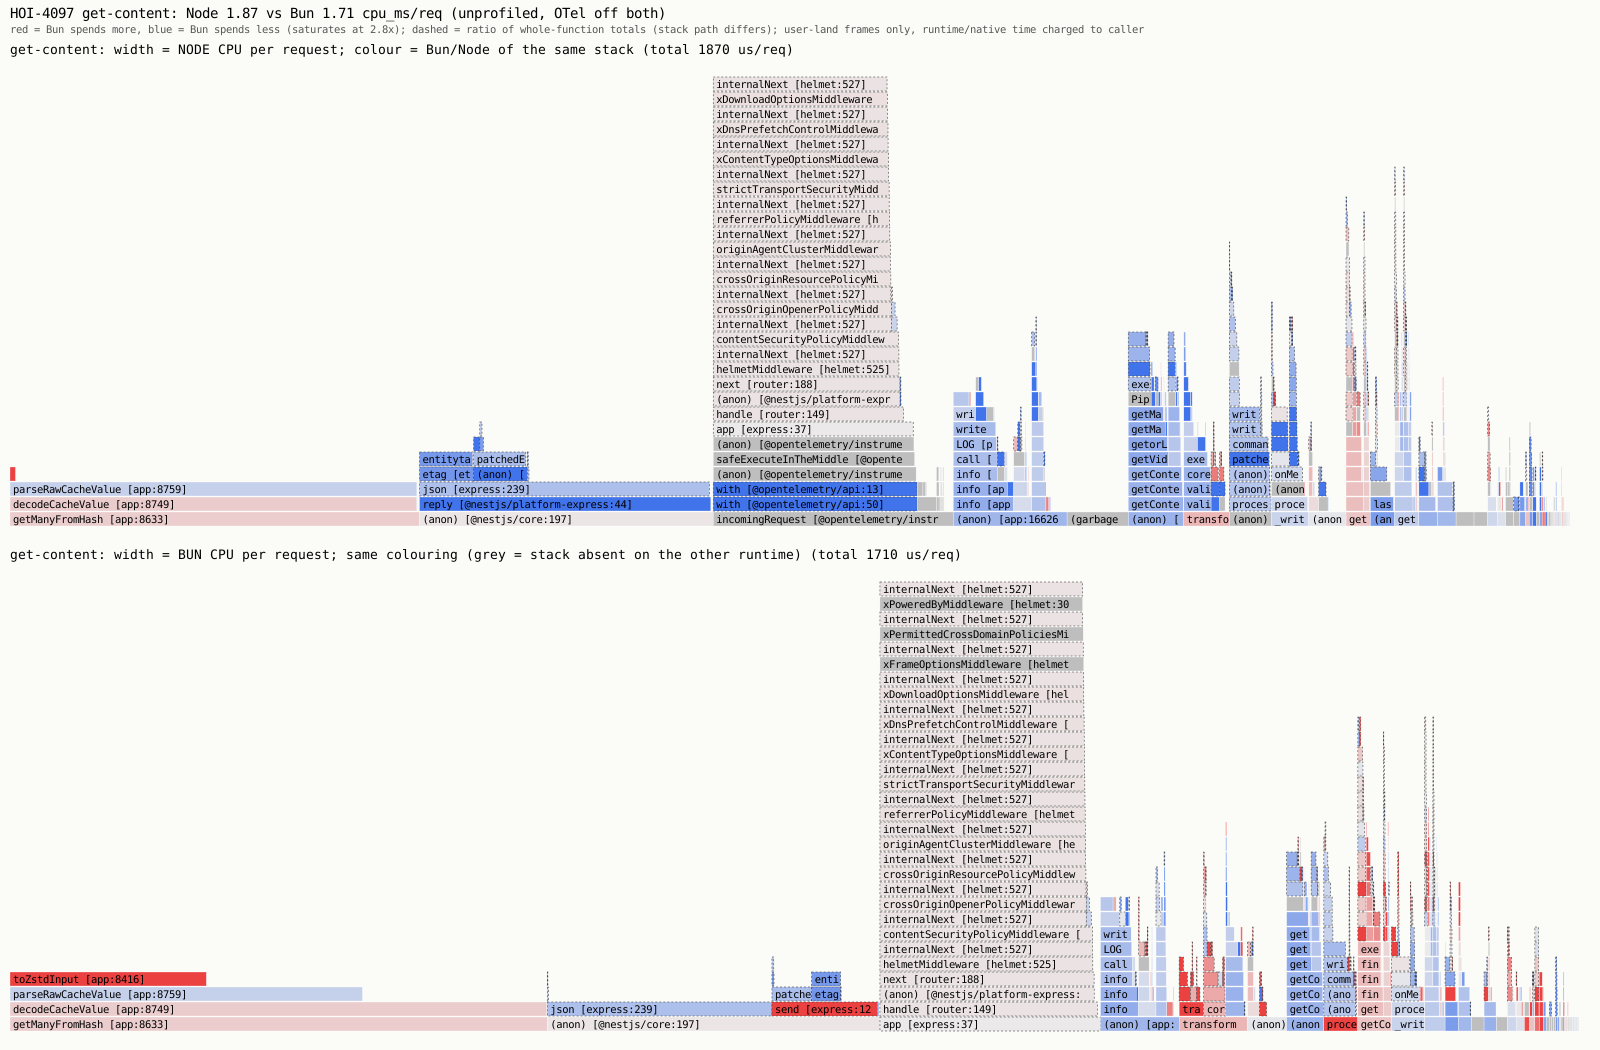
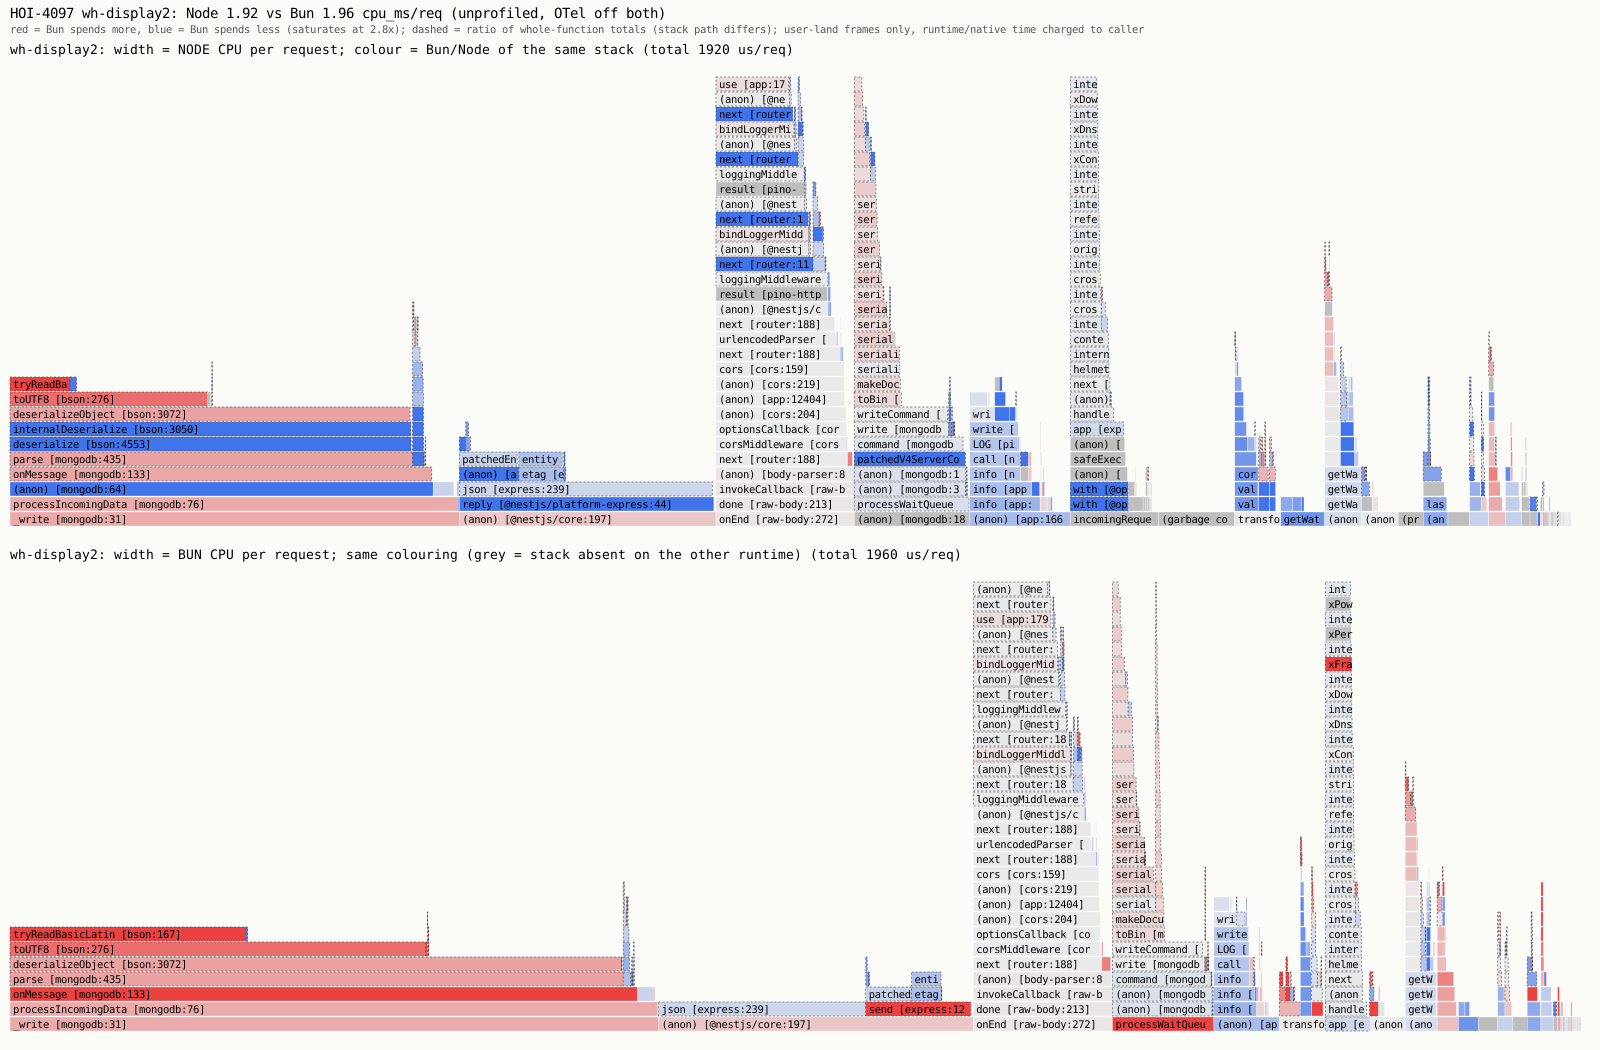
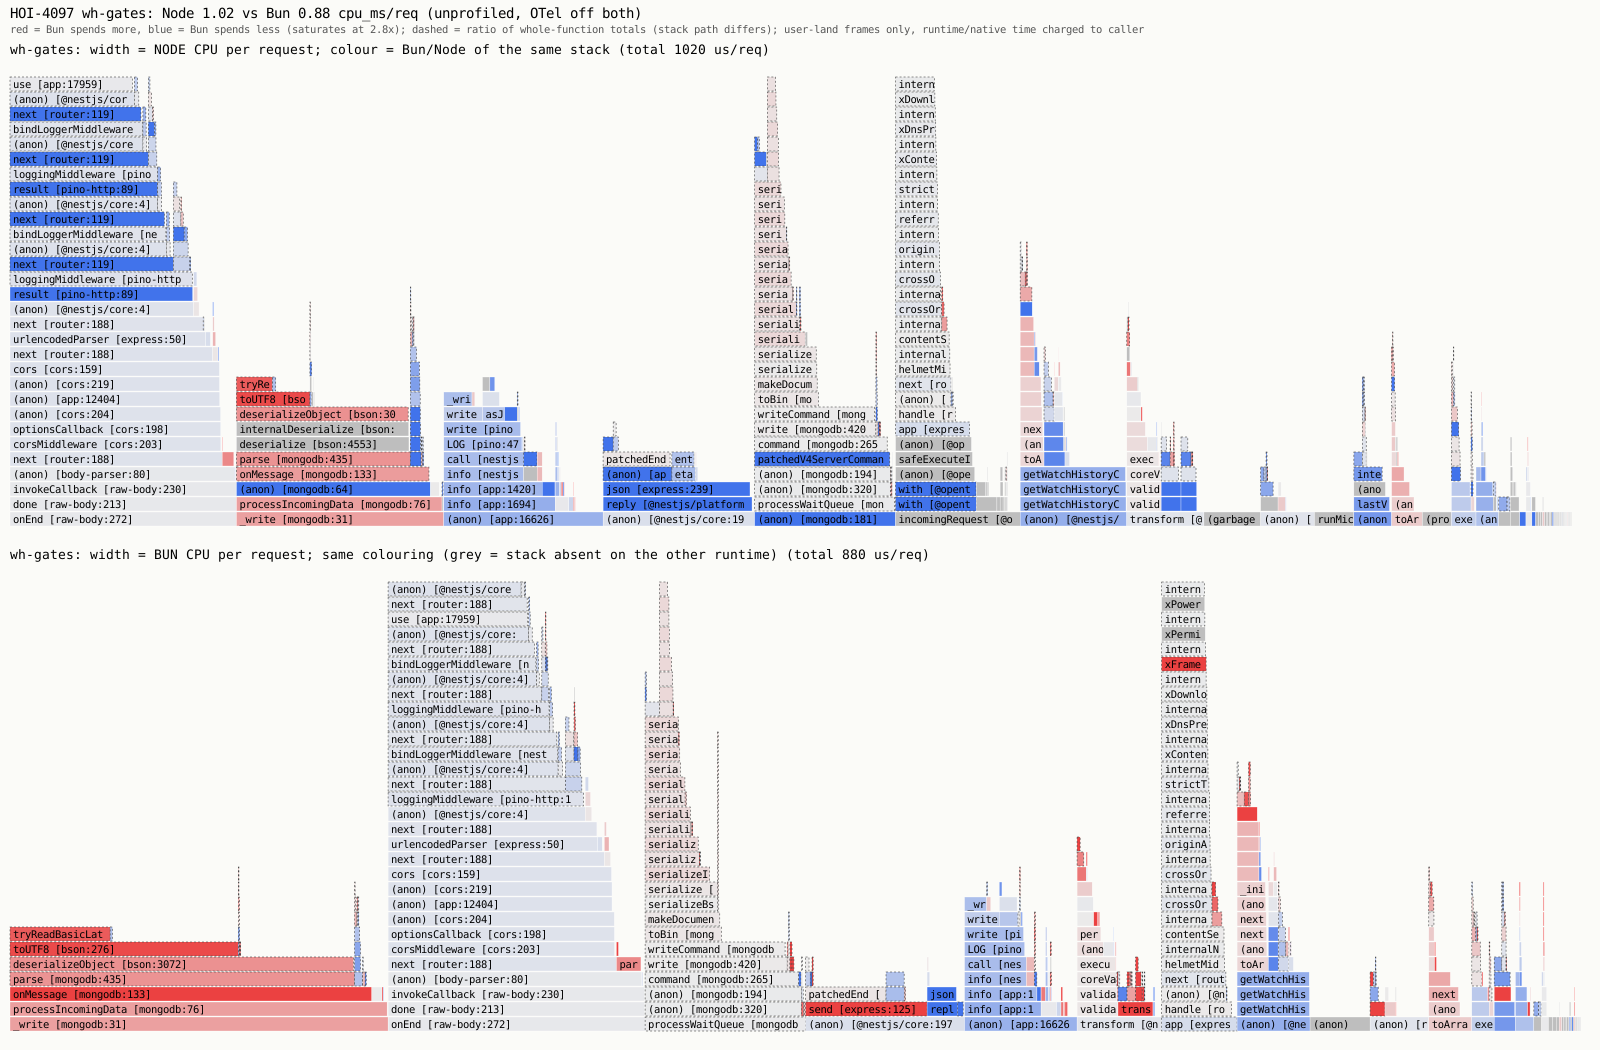
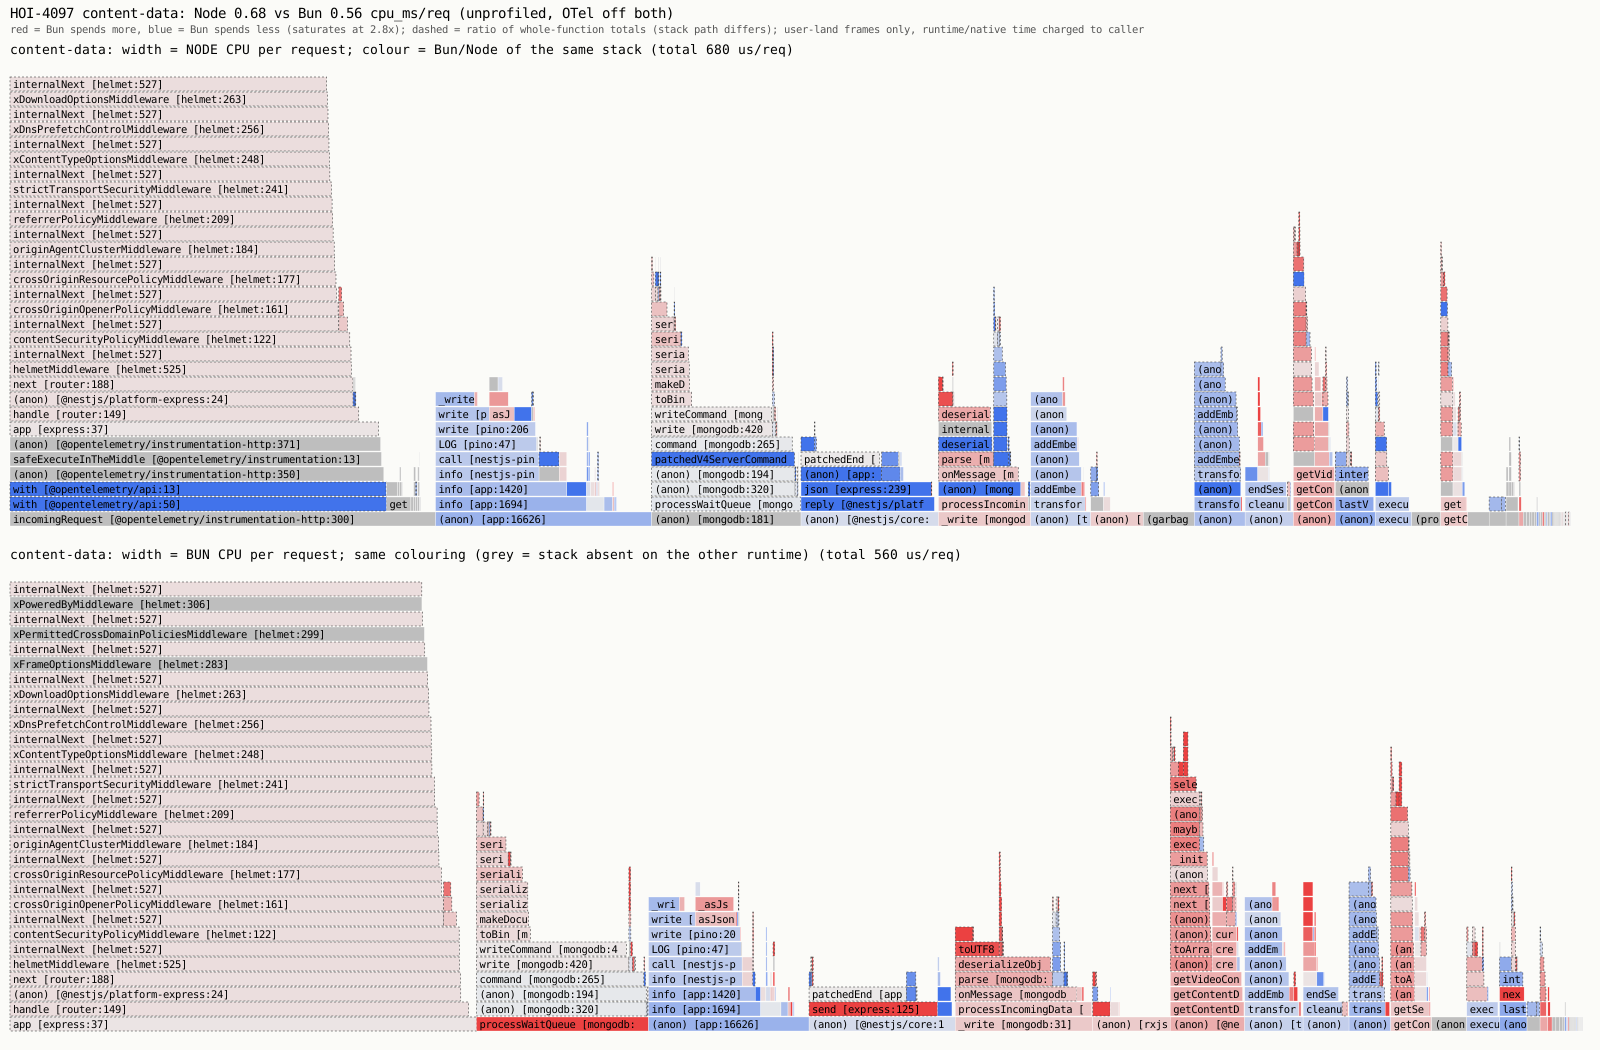
Why Bun is faster here (from the differential profiles below): no V8 garbage-collection pauses in the hot path (GC ≈ 45 µs/req on Node's watch-list, ~0 sampled on Bun), cheaper reply JSON.stringify and ETag hashing on large pages, and cheaper OTel span work. Bun is *slower* on BSON decode, regexes and our own app code, which is why Mongo-heavy routes gain little.
Watch-list page: Node vs Bun differential flame graph
Single title: Node vs Bun differential flame graph
Watch-history display: Node vs Bun differential flame graph
Watch-history gates: Node vs Bun differential flame graph
contentData: Node vs Bun differential flame graph
Entitlement (play): Node vs Bun differential flame graph
Page routes: Node vs Bun differential flame graph
The 5 hot read routes rewritten on raw node:http (same Valkey/zstd/Mongo reads, same JSON, 0 differences on 2,294 requests), Node 26, both uncompressed:
| Route | Nest ms/req | Rewrite | Change | req/s | anon MiB |
|---|---|---|---|---|---|
| Single title | 2.28 | 1.14 | −50% | 550 → 1,084 | 277 → 107 |
| Watch-list | 1.55 | 0.57 | −63% | 762 → 2,026 | 279 → 83 |
| contentData | 0.89 | 0.18 | −80% | 1,227 → 4,350 | 271 → 74 |
| Watch-history gates | 1.22 | 0.45 | −63% | 924 → 1,295 | 260 → 73 |
| Watch-history display | 2.38 | 1.32 | −45% | 504 → 855 | 259 → 90 |
The rewrite skips request logging, OTel spans and token/IP/Origin handling (those requests proxy to Nest; the test mix had none), so part of the gap is that work. On the same rewrite, Bun is −25% to −41% on decode/compression-heavy routes and noise on Mongo-bound ones.
| Compiler | Runs our code? | Single-title route vs same code on Node | Memory · startup |
|---|---|---|---|
| scriptc 0.4.8 (Vercel Labs) | Rewrite only | −49% CPU (0.339 → 0.174 ms), 0 differences on 1,662 | 4–5 MiB · 8 ms |
Bun --compile / --bytecode | Yes | same as Bun (bytecode halves startup) | ~42 MB · 17–34 ms |
| Perry 0.5 | Rewrite only | +12% (slower) | 16 MB · 10 ms |
| Porffor alpha 22 | Rewrite only | +334% (JSON 9–10× slower than V8) | 5.6 MB · 10 ms |
| scriptc on the Nest app | No | 92 internal compiler errors on decorator classes; 15,976 of 17,836 statements dynamic | — |
| ts-aot, Static Hermes | Not run | no linux/aarch64 build | — |
Nest itself starts in ~2.1 s; the rewrite on Node in 38 ms. A compiler only helps after the hot routes leave the framework; the Mongo driver, ioredis and bson would still run as Node islands.
NestJS's 2× is real on hello-world (minimal Nest 38.6 → 19.0 µs/req) but it's a fixed ~20–30 µs of dispatch plus ~50 µs of repeated qs parsing that Express 5 does on every req.query read. On our routes (0.9–3.7 ms/req) that's −10% on contentData, −5% on watch-list, ~2% elsewhere. Most of the 'framework' cost is Nest core (router context, rxjs interceptors, ValidationPipe), which every adapter keeps. Bigger costs sit outside the adapter: telemetry, in-pod compression, the request logger.
Bun as the toolchain, not just the runtime
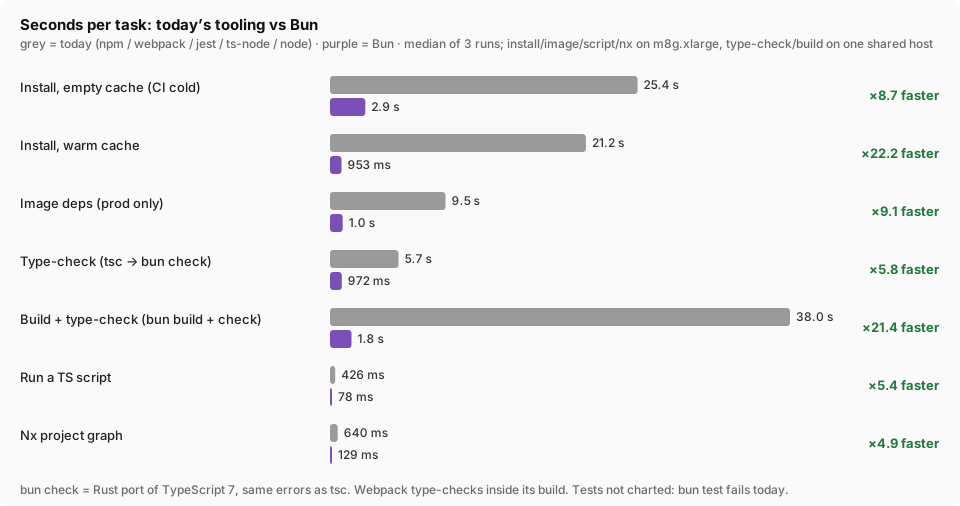
Measured on the same repo and commit, on a dedicated m8g.xlarge (prod's instance type), 3 runs each unless noted. Today = npm, nx + webpack, jest, ts-node, Node 22. Raw data: lab/toolbench/out/*.jsonl.
| Area | Measured | Compatibility found | Feasibility | Effort |
|---|---|---|---|---|
Package install (npm → bun install) | cold 25.4 s → 2.9 s; warm 21.2 s → 953 ms; node_modules 1590 → 1302 MB | Blocks 16 install scripts until listed in trustedDependencies (incl. @riaskov/mmap-io, @swc/core, @parcel/watcher); mmap-io loads after trust: True. With install scripts: npm 73.6 s vs bun 3.8 s | Ready. bunfig.toml scope for the private registry, trustedDependencies, bun.lock; one line per CI workflow (15) and Dockerfile | S · 1–2 days |
Image deps stage (npm ci --omit=dev → bun install --production) | 9.5 s → 1.0 s; 648 → 614 MB | Base image (arm64, compressed): node:22-alpine 58.3 MB · oven/bun alpine 55.4 MB · distroless 57.1 MB | Ready with the install switch. Runtime base image changes only if the runtime moves to Bun | S · with the above |
Build (nx + webpack → bun build) | 38.0 s (webpack, includes type-check) → 808 ms bun build + 972 ms bun check; same host, 3 runs each. bundle 2.2 MB (deps external) vs 24 MB (deps inlined, needed on Bun) | Boots: DI complete, 20 Nest modules loaded, stops at the same missing Mongo URI. Decorators: 1813 legacy, 0 standard. Changes it took: eslint --fix @typescript-eslint/consistent-type-imports + consistent-type-exports: 449 files, 1,257 lines, ~1 min · import type for interfaces used as constructor params (eslint keeps them as values because of emitDecoratorMetadata): 66 symbols, 602 file edits; safe because TS emits Object for interfaces · @contents/* path alias -> relative imports in 24 files: through the alias Bun compiled 101 entity decorators as TC39 standard decorators, breaking TypeORM · bundle npm deps into the output (like webpack): Nest 12 is an ES module that CommonJS deps (nestjs-pino) require(); Bun refuses require() of async ESM at runtime · externals list for optional packages Nest/TypeORM/mongodb probe (microservices, websockets, fastify, sql drivers, ts-morph, @apollo/subgraph) · 1 type-only import from a package (cache-manager Cache). After the changes: contents jest 32/32 suites, 254/254 tests pass; webpack build of the edited source boots on Node | Feasible, proven to boot. Most changes are lint autofixes that also help swc/esbuild. Not yet load-tested or parity-checked against the webpack build | M · ~2–3 days for content (codemods + alias rewrite + externals + parity run), then ~1 day per other app |
Type-check (tsc 6 → bun check, Bun 1.4.3+) | tsc 5.7 s → tsgo (TS 7, Go) 1.1 s → bun check 972 ms (wall incl. ~0.5 s container start; its own timing: 0.25 s load + 0.23 s check of 790 files) | Same errors as tsc on our code. Needs baseUrl removed from tsconfig (removed in TS 7; our paths are already ./-relative). No typescript package needed | Ready. Replaces tsc --noEmit in CI and editors' CLI checks; tsc stays for emit until the build moves | XS · tsconfig edit + one CI line |
Tests (jest → bun test) | 6.3 s (jest, passing) vs — (bun, failing) | Jest passes (42 guard tests, 254 contents tests). Bun test: 2 of 9 guard specs pass; others fail on Nest 12 (module package) required from CommonJS and on the same decorator mode. Spec files: 150; jest APIs used: jest.mock 19, jest.spyOn 21, jest.fn 93, jest.useFakeTimers 3, jest.requireActual 4, jest.resetModules 1, expect.objectContaining 37 | Not yet. Needs ESM test setup or a bun-compatible require of Nest 12, then re-check mocks file by file | L · 1–2 weeks across all specs; can run side by side with jest |
Scripts (ts-node → bun file.ts) | 426 ms → 78 ms | Runs plain TypeScript scripts directly. Scripts that import decorated Nest/TypeORM classes hit the decorator-mode issue | Ready for plain scripts (tools/, codemods); not yet for scripts that boot Nest (offline OpenAPI gen) | XS · hours |
| Task runner (nx on node → nx on bun) | 640 ms → 129 ms (project graph) | Bun workspaces have no task graph, cache or affected; nx stays | Keep nx. Run it under bun only if it is faster and stable | — |
Patches (patch-package / Dockerfile patch → bun patch) | — | bun patch prepare: rc=0 · bun patch v1.4.4 (38afee6c8)[12.10ms] migrated lockfile from package-lock.jsonSa | Move the device-detector patch to patchedDependencies with the install switch; removes the Dockerfile patch -p1 step | XS |
Do now (no runtime change)
bun installeverywhere: CI, Dockerfiles, laptops. ×8.7 faster cold, ×21 warm, ×9 for the image deps stage, 300 MB smaller node_modules.trustedDependenciesfor the 16 packages with install scripts we need (mmap-io first).bun patchfor the detector patch;bunfor plain TS scripts.
With the Bun runtime canary
- Keep webpack for the first canary (already load-tested on Bun); switch to
bun buildonce its parity run passes. import typecodemod + eslintconsistent-type-imports: needed by bun build, swc and esbuild alike.- Watch memory: +100–300 MiB per pod (see the runtime section).
Later, its own project
bun build: boots after codemods (see table). Next: response-parity and load A/B of the bun-built image vs webpack-built.bun test: blocked by Nest 12 ESM-from-CommonJS and the same decorator issue. Keep jest.- Keep nx: Bun has no task graph, cache or affected builds.
Keeping it fixed: regression guards
Approach
Timing tests on shared CI runners are noisy (±20% run to run), so a CPU budget there either flaps or is too loose to catch anything. Every regression we fixed has a countable cause — calls per page, reads per title, slow-path JSON objects, log lines — so the guards count work, not time. Time is checked where it is stable: the lab and prod.
| Layer | What it catches | Where | Status |
|---|---|---|---|
| 1. Count specs on every PR | Watch-list fan-out (1 batch call per page, 0 per-item calls, at 54 items); pages read each title once; reply objects are plain (fast JSON path); detector patch still applies and matches stock; identity header on internal calls; logger skips disabled levels; one Mongo Db handle per client; card/tray cache projections; hinted single-type lookup; projected repository reads; one shared detector | content-cpu-guards.yml — 15 suites, fails if fewer than 15 ran | In PR #4593 |
| 2. Work budgets | A new per-request cost slipping in (e.g. a regex compiled per call, a deep clone): CPU instructions per request on recorded requests, which vary <1% run to run, with a 25% margin | Nightly job on one fixed runner | Proposed |
| 3. Weekly lab A/B | Real CPU ms / request and req/s per route, main vs last release, same pod type as prod, 3 interleaved rounds | UAT lab lane (the scripts behind this report) | Proposed |
| 4. Prod alerts | CPU ms per request per route, and content calls per core watch-list request, drifting above today's level | SigNoz alerts as code (create-signoz-alerts.py) | Proposed |
What layer 1 does not cover: it pins the specific causes fixed here. A *new* endpoint, or a new kind of cost (a regex built per call, a deep clone, a new middleware), passes it unless someone writes a count spec for it. Layers 2–4 measure cost directly and catch those.
Before this PR no unit test ran on pull requests to main or uat: the only test workflow targets develop. Layer 1 is the cheapest fix and would have caught the biggest cause of the 504s, the watch-list fan-out, the day it was written.
What to do next
| # | Option | Measured gain | Cost / risk |
|---|---|---|---|
| 1 | Ship the branch (20 changes, incl. device-detector patch via patch-package) | the totals at the top of this page | Low; push + PR + UAT soak |
| 2 | 2 worker threads per pod | see threads section | Medium: +~270 MiB RSS per pod (measured), pool sizing, soak |
| 3 | Trim telemetry (sampling / lighter http instrumentation) | see telemetry section | Observability trade-off |
| 4 | Compression for gzip/br clients off the event loop or at the edge | up to −37% on those requests | Low–medium |
| 5 | Request logger: build context once, read req.query once | up to −7–11% | Low |
| 6 | NodeAdapter | −10% contentData, −5% watch-list | 2 parity gaps to sign off |
| 7 | Hot read routes without the framework (proxy the rest to Nest) | −45% to −80% CPU, ×1.4–3.5 req/s | High: two code paths; logging/OTel/auth to re-add |
| 8 | Bun (stacked branch, telemetry on) | −4% to −27% CPU on all 7 routes, Bun lower in 21/21 rounds | Medium: +100–300 MiB per pod, SigNoz delivery + 24 h soak before switching |
| 9 | scriptc native edge for cache-hit routes | −49% vs Node on the rewrite | Very high: experimental, Node islands for DB clients |
How it was measured
- Lab
- UAT cluster, one m8g.xlarge per lane (prod's instance type), pod limit 2 CPU / 2 GiB like prod, Node 26.13 (what prod runs), real UAT Mongo/Valkey.
- Load
- Prod-shaped scenarios from SigNoz, closed-loop driver on its own node per lane, warm-up then 20 s measured, 3+ interleaved rounds, medians.
- CPU / memory
- CPU from the pod's cgroup ÷ successful requests; memory = node RSS and cgroup anon sampled every second during the run.
- Proof
- A change counts when the difference beats run-to-run spread (or is lower in every paired round), with 0 errors and identical responses side by side.
- Honesty
- Contaminated runs (a leaking env in the lab's restart loop, an orphaned listener, a mislabeled arm) were found, excluded and kept for audit; the final numbers on this page come from clean reruns that record the process environment.